Visualization · Styling & themes
Styling & themes
Every plot TSDynamics produces is a backend-agnostic
Plot: a semantic description of a figure — what to draw and
what it means — rendered on demand by matplotlib, plotly, or the
three.js / JSON exporters. Nothing about a spec is tied to a
drawing library, which is exactly what lets one figure render identically
everywhere.
The styling layer controls how that figure looks — line colours and widths, markers, opacity, gridlines, fonts, backgrounds — through one canonical, validated, introspectable vocabulary that every visual backend honors consistently. This page is the full reference: the style keys, the theme system, every fluent tweak, and the honest per-backend honoring contract.
There are two levers, and they compose:
- Per-layer style — the look of one drawable (a line, a scatter, an image):
color,linewidth,marker,alpha, … Set with.style(...)/.recolor(...). - The figure-level
Theme— palette, font, background, grid, and line / marker defaults shared across the whole figure. Set with.theme(...)and its conveniences.palette/.grid/.font/.background/.size, or globally withthemes.use.
A theme is applied first — it auto-colours every layer that carries no explicit colour — and per-layer style then overrides it. All of these are fluent tweaks: they mutate the spec and return it, so they chain in any order and render the same on every backend.
import tsdynamics as ts

p = (
    ts.plot(ts.systems.Lorenz(ic=[1.0, 1.0, 1.0]), components=["x", "z"])
    .theme("dark")                    # figure-level look
    .gridlines()                      # gridlines on
    .recolor("crimson")               # this layer's colour
    .style(lw=2, linestyle="dashed")  # this layer's line
)
p.save("lorenz-dark.png")             # matplotlib (by extension)
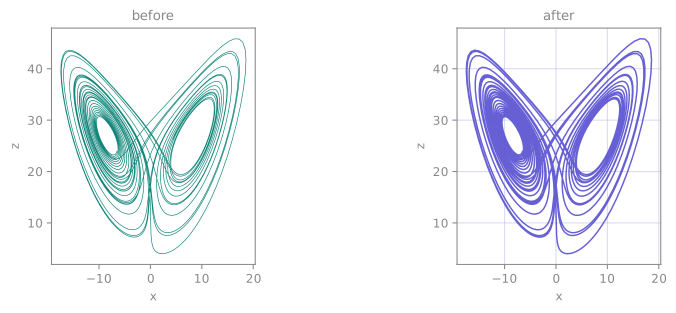
(x, z) portrait, twice. Left: a bare ts.plot(traj) — default palette, no grid, backend background. Right: the identical trajectory after one chained recipe — .recolor("#11857A"), .style(lw=2.2, alpha=0.85), .gridlines(color="#9aa7b0", alpha=0.4), .background("#faf7f2"). The data is byte-for-byte identical; only the presentation layer changed, and the same recipe would render the same on plotly.Everything below is runnable as shown. Where a snippet prints a value it pins an
explicit initial condition (ic=), because most catalogue systems have
default_ic=None and draw a fresh random start each run — a reproducible figure
needs a reproducible orbit.
The style vocabulary
STYLE_KEYS is the closed, reviewed per-layer vocabulary. Each entry is a
StyleKey carrying its canonical name, the accepted aliases, the backends that
genuinely honor it, a value validator, and a one-line doc — so there is no
guesswork about what a key accepts or where it lands.
| Canonical | Aliases | Honored by | Meaning |
|---|---|---|---|
color |
c |
mpl, plotly, three.js | line / marker / fill colour (CSS name, hex, or rgb tuple) |
linewidth |
lw |
mpl, plotly, three.js | line width, pt (≥ 0) |
linestyle |
ls |
mpl, plotly | one of solid, dashed, dotted, dashdot |
marker |
— | mpl, plotly | one of circle, square, triangle, diamond, cross, x, star, none |
markersize |
ms, s |
mpl, plotly, three.js | marker size, pt (≥ 0) |
alpha |
opacity |
mpl, plotly, three.js | opacity in [0, 1] |
cmap |
colormap, colorscale |
mpl, plotly | colormap name for the colour / image channel |
fill |
— | mpl, plotly | fill the area under / between (bool) — AREA marks only |
fillalpha |
— | mpl, plotly | fill opacity in [0, 1] — AREA marks only |
zorder |
— | mpl, plotly, three.js | integer draw order (three.js maps it to renderOrder) |
The table is not lore — it is generated from the live STYLE_KEYS table, and you
can read the same facts off it directly:
>>> import tsdynamics as ts
>>> sorted(ts.viz.STYLE_KEYS)
['alpha', 'cmap', 'color', 'fill', 'fillalpha', 'linestyle', 'linewidth', 'marker', 'markersize', 'zorder']
>>> key = ts.viz.STYLE_KEYS["linewidth"]
>>> key.aliases, key.doc
(('lw',), 'line width (pt)')
>>> sorted(ts.viz.STYLE_KEYS["linestyle"].honored_by)
['matplotlib', 'plotly']
Aliases
Every key accepts the friendly short spellings shown above, and a handful of
values are canonicalised too — the matplotlib short line styles
(-, --, :, -.) and single-character markers (o, s, ^, D, +,
x, *). Everything is rewritten to canonical form before storage, so the spec
only ever holds canonical keys and the renderers never have to guess:
>>> from tsdynamics.viz import normalize_style
>>> normalize_style({"lw": 2, "c": "red", "s": 8, "ls": "--"})
{'linewidth': 2.0, 'color': 'red', 'markersize': 8.0, 'linestyle': 'dashed'}
(marker carries no key-name aliases — STYLE_KEYS["marker"].aliases == () —
because its alternate spellings are the value aliases o s ^ D + x *,
canonicalised by the validator rather than the key-name index.)
Validation
Values are coerced and range-checked by each key's validator. A bad value raises
ValueError at the call site rather than silently producing a broken plot:
>>> normalize_style({"alpha": 1.5})
Traceback (most recent call last):
    ...
ValueError: invalid value for style key 'alpha': expected a value in [0, 1], got 1.5
The rules:
- Sizes (
linewidth,markersize) must be non-negative. - Opacities (
alpha,fillalpha) must lie in[0, 1]. zordermust be a genuineint— a float2.0raises (no silent floor); a NumPy integer is accepted.- A
boolis rejected where a magnitude is expected —alpha=Trueis almost always a mistake, so it raises instead of quietly becoming1.0.
>>> normalize_style({"zorder": 2.0})
Traceback (most recent call last):
    ...
ValueError: invalid value for style key 'zorder': expected an int, got 2.0
>>> normalize_style({"alpha": True})
Traceback (most recent call last):
    ...
ValueError: invalid value for style key 'alpha': expected a value in [0, 1], got bool True
Unknown keys warn — they are never silently swallowed
A typo or an unsupported key is dropped with a single warning, naming the
offending key(s) and listing the vocabulary. There is no more "I set
colour='red' and nothing happened":
>>> import warnings
>>> with warnings.catch_warnings(record=True) as w:
...     warnings.simplefilter("always")
...     normalize_style({"colour": "red", "lw": 2})
{'linewidth': 2.0}
>>> w[0].category.__name__
'VisualizationDegraded'
>>> str(w[0].message)
"unknown style key(s) dropped: 'colour'; known keys are alpha, cmap, color, fill, fillalpha, linestyle, linewidth, marker, markersize, zorder"
normalize_style is the single choke point every style dict passes through —
both the .style(...) tweak (when a user sets keys) and each renderer (before it
translates canonical keys to backend kwargs) — so this guarantee holds
everywhere.
Fluent tweak methods
Every tweak mutates the spec and returns self, so they chain top to bottom
in any order and render identically on every backend. They split into three
groups: the axis/label tweaks, the per-layer style tweaks, and the
figure-level theme tweaks.
Axis & label tweaks
These reshape the axes without touching the data or the look.
p = (
    ts.plot(ts.systems.Rossler(ic=[0.1, 0.1, 0.1]), components=["x", "y"])
    .relabel(x="x(t)", y="y(t)", title="Rössler x–y")
    .limits(x=(-12, 12), y=(-12, 12))
    .ticks(x=[-10, 0, 10])
    .rescale(y="linear")
    .colorize(colorbar=False, legend=False)
)
| Method | Signature | What it does |
|---|---|---|
.relabel |
x=, y=, z=, title= |
set axis labels / title (only the args you pass; z ignored if 2-D) |
.rescale |
x=, y=, z= |
axis scale — "linear" / "log" / "symlog" |
.limits |
x=, y=, z= |
(lo, hi) view limits per axis |
.ticks |
x=, y=, z= |
explicit tick locations per axis |
.colorize |
clim=, colorbar=, legend= |
the colour range, and whether a colorbar / legend shows (each a Colorbar/Legend object or a bool) |
Each keyword defaults to "leave unchanged", so a tweak only touches what you name.
.style(**keys, layer=None, axes=None)
Merge style keys into one layer or every layer. **keys go through
normalize_style (aliases canonicalised, values validated, unknown keys warned).
spec = ts.plot(ts.systems.Rossler(ic=[0.1, 0.1, 0.1]))

spec.style(color="teal", lw=2, alpha=0.8)   # apply to every layer
spec.style(linestyle="dotted", layer=0)     # apply to layer 0 only
spec.style(axes=False)                        # hide the axes entirely
layer=None (the default) applies to every layer; an int targets one layer.
axes=False is a figure-level switch, not a style key: it hides ticks,
labels, gridlines, and (in 3-D) the grey background panes — for a clean
"attractor floating in space" still or animation. It is recorded as
meta["axes_visible"] = False and every backend honors it (mpl
ax.set_axis_off(), plotly visible=False, three.js drops the grid). It pairs
naturally with .camera(...) for a headline attractor figure.
.recolor(*colors, layer=None)
The per-layer colour shorthand. With no layer, colour i is assigned to layer
i, cycling if there are more layers than colours; with an int layer, that one
layer is set to colors[0]:
# Two 3-D attractors overlaid on one set of axes, coloured by source.
ts.plot(
    ts.systems.Lorenz(ic=[1.0, 1.0, 1.0]),
    ts.systems.Rossler(ic=[0.1, 0.1, 0.1]),
).recolor("crimson", "royalblue")
.recolor("teal") is exactly .style(color="teal") on layer 0; recolor earns
its place when a composite has several layers you want coloured in one call.
.theme(name | Theme, /, **overrides)
The figure-level look (palette / font / background / grid / line defaults). The
theme argument is positional-only — call spec.theme("dark"), never
spec.theme(theme="dark") (the keyword name is reserved so a theme field
literally called theme could go in **overrides). Pass a registered name, a
Theme instance, or None (snapshot the active global default now), and
optionally override individual fields on top:
spec.theme("publication")                     # a named built-in
spec.theme("dark", font_family="monospace")   # built-in + field override
spec.theme(None, line_width=2.0)              # global default + override
Snapshot semantics. .theme("dark") pins the dark theme onto the spec. A
spec that never calls .theme(...) carries no theme of its own and resolves to
the active global default at render time (so it tracks a later
themes.use); calling .theme(...) — even
.theme(None, ...) — materialises a concrete theme now and detaches the spec
from future global-default changes. You can always read the effective theme back:
>>> import tsdynamics as ts
>>> ts.plot(ts.systems.Lorenz(ic=[1.0, 1.0, 1.0])).resolved_theme.name
'default'
>>> ts.plot(ts.systems.Lorenz(ic=[1.0, 1.0, 1.0])).theme("dark").resolved_theme.name
'dark'
spec.resolved_theme is the read half of the pattern (.theme(...) sets,
resolved_theme reads, spec._theme is the raw private field).
.palette, .grid, .font, .background, .size
Conveniences that each touch one facet of the theme (or, for .size, the figure
geometry). All are theme overrides layered on the resolved theme, so they compose
with .theme(...) and with each other:
spec.palette(["#11857A", "#574FCF", "#E8A33D"])  # explicit colour cycle
spec.palette("dark")                              # borrow a registered theme's palette
spec.gridlines(show=True, axis="y", color="#9aa7b0", alpha=0.3)  # y-axis gridlines, styled
spec.font(family="serif", size=12)                # theme font family / size
spec.background("#0b1020")                         # figure / axes facecolor
spec.size(width=8, height=5, dpi=150)              # figure geometry
Notes:
.paletteaccepts a registered theme name (borrows its palette), a bare colour string (a one-colour palette), or an explicit sequence — the sameresolve_palettelogic:
>>> from tsdynamics.viz.style import resolve_palette
>>> resolve_palette("dark")[0]          # borrow the dark palette
'#4cc9f0'
>>> resolve_palette("#ff0000")          # a bare colour → a one-colour cycle
('#ff0000',)
.gridtoggles gridlines on"x"/"y"/"both"(default"both"); passingcolor=/alpha=also sets the theme'sgrid_color/grid_alphaso the styling is shared across the figure..sizeis deliberately not a theme field —figsize/dpiare figure geometry, stored inspec.meta(meta["figsize"],meta["dpi"]). Only the dimensions you pass are updated.
Chaining
Because every tweak returns self, a full figure recipe reads top to bottom —
axes, then look, then geometry:
p = (
    ts.plot(ts.systems.Lorenz(ic=[1.0, 1.0, 1.0]), components=["x", "z"])
    .relabel(x="x(t)", y="z(t)", title="Lorenz x–z")
    .theme("dark")
    .gridlines(color="#3a3f4b", alpha=0.6)
    .recolor("#4cc9f0")
    .style(lw=1.6, alpha=0.9)
    .font(family="monospace")
    .size(width=7, height=7)
)
p.save("lorenz.png")       # matplotlib, by extension — honors the whole chain
Note the extension. Saving this same chain as .html routes to plotly, which
does not honor figsize (see the honoring table above), so the .size(...) step
would be dropped with a VisualizationDegraded warning naming it. That is the
contract working as designed: a backend that cannot render a tweak says so
rather than silently ignoring it.
The static tweaks compose with the animation modifiers
(.animate / .trail / .head / .camera / .clock) the same way — they are
all mutate-and-return-self, so a static recipe and a movie recipe are the same
chain with a .animate(...) appended.
Themes
A Theme is a frozen dataclass describing the figure-level look applied
before per-layer style:
| Field | Meaning |
|---|---|
palette |
colour cycle for auto-coloured layers (those with no explicit color) |
background |
figure / axes facecolor |
foreground |
default ink — text / axes / ticks colour |
font_family, font_size, title_size |
typography |
grid, grid_color, grid_alpha |
default gridline visibility / look |
line_width, marker_size |
default line / marker sizes |
figsize, dpi, layout_engine |
figure geometry — honoured by matplotlib; plotly declines them with a VisualizationDegraded |
Because it is frozen it is safe to share and cache, and you never have to build
one: ts.viz.themes.register(name, **fields) takes the keywords directly, and
returns the built theme if you want it. Deriving from an existing theme is the
same call with the original passed positionally:
lab = ts.viz.themes.register("lab", ts.viz.themes.get("minimal"),
                             palette=("#0b6", "#e63"), font_family="serif")
lab.background          # the built theme, if you want the object
ts.viz.themes.get("minimal").palette   # ...and the original is untouched
The built-in themes
Four themes ship out of the box, applied per figure with .theme(...):
| Theme | Look |
|---|---|
default |
light background, a clean 10-colour qualitative palette, sans-serif, grid off |
dark |
near-black background (#11131a), light ink (#e6e6e6), a brighter 10-colour palette |
minimal |
light, a muted palette, slightly thinner lines (line_width=1.2), grid off |
publication |
serif font, larger labels / titles (font_size=12, title_size=15), a colourblind-safe palette (Wong 2011, 8 hues) |
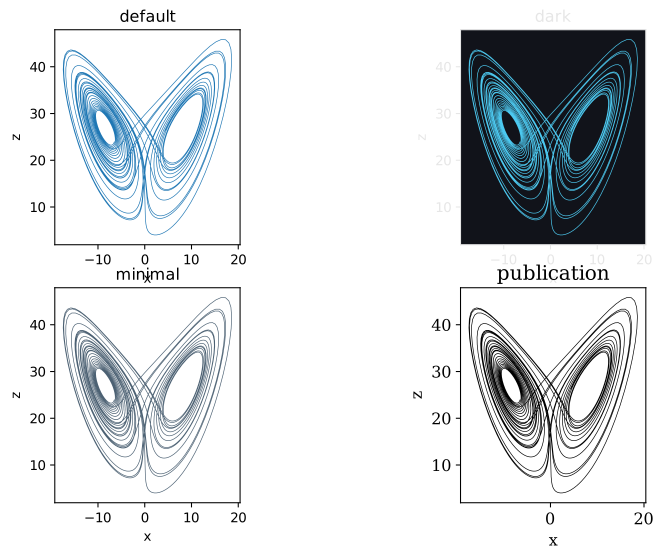
(x, z) portrait, four themes, tiled with ts.plot(..., layout="grid"). Only the theme differs between panels: default (matplotlib-ish blue on white), dark (bright cyan on #11131a — the panel keeps its near-black background through the composite), minimal (muted slate, thinner line), and publication (serif labels, larger type, the colourblind-safe Wong palette). Switching theme is a one-word change to the recipe.>>> import tsdynamics as ts
>>> ts.viz.themes.names()
['dark', 'default', 'minimal', 'publication']
>>> ts.viz.themes.get("publication").font_family, ts.viz.themes.get("publication").title_size
('serif', 15.0)
>>> ts.viz.themes.get("dark").background, ts.viz.themes.get("dark").palette[0]
('#11131a', '#4cc9f0')
Apply one and save straight to a paper-ready vector:
Registering your own
ts.viz.themes.register(name, **fields) takes plain keywords — there is no
library type to build. The theme then joins themes.names() and is reachable by
name everywhere a name is accepted (.theme("mine"), .palette("mine"),
themes.use("mine")):
ts.viz.themes.register(
    "tsd-brand",
    palette=("#11857A", "#574FCF", "#E8A33D", "#C2405A"),  # teal · indigo · amber · rose
    background="#faf7f2",
    foreground="#1c2b2d",
    font_family="serif",
    grid=True,
    grid_color="#9aa7b0",
    grid_alpha=0.35,
    line_width=1.6,
)

ts.plot(ts.systems.Lorenz(ic=[1.0, 1.0, 1.0])).theme("tsd-brand")   # usable by name
Derive one from a built-in by passing it positionally and overriding fields:
>>> ts.viz.themes.names()                       # after registering
['dark', 'default', 'minimal', 'paper', 'publication', 'tsd-brand']
>>> ts.viz.themes.get("tsd-brand").background
'#faf7f2'
register returns the built Theme, so it is also the one-liner form of
"build a theme object" when you genuinely want one.
A registered theme is the right home for your lab's or paper's house style — set
it once, then every figure is one .theme("tsd-brand") (or one
themes.use) away.
The global default
themes.use / themes.get read and write the single mutable global in the viz
layer — the active default theme that any spec without its own theme resolves to
at render time:
>>> ts.viz.themes.get().name          # the active default
'default'
>>> ts.viz.themes.use("dark")         # every un-themed plot is now dark
>>> ts.viz.themes.get().name
'dark'
>>> ts.viz.themes.use("default")      # back to baseline
themes.use accepts a registered name or a Theme instance (which it
registers and activates in one step). themes.use("default") always returns to
the baseline. Because a spec that never called .theme(...) resolves lazily,
switching the global default re-themes every such spec on its next render — set it
once at the top of a notebook or script and every plot follows:
ts.viz.themes.use("publication")
ts.plot(ts.systems.Lorenz(ic=[1.0, 1.0, 1.0])).save("fig1.pdf")   # publication-themed
ts.plot(ts.systems.Rossler(ic=[0.1, 0.1, 0.1])).save("fig2.pdf")  # …and so is this
ts.viz.themes.use("default")                                      # tidy up
Global vs. pinned
Use themes.use(...) for a document-wide default that every un-themed
plot should follow, and .theme(...) to pin one figure regardless of the
global. A pinned plot ignores a later themes.use; an un-pinned one tracks
it.
Per-backend honoring
The three visual backends differ in what they can render. Each StyleKey
declares its honored_by set — the backends that genuinely apply it — and this is
an enforced contract: where a backend cannot honor a knob you set, the
renderer emits one consolidated VisualizationDegraded naming the dropped
knobs, rather than silently ignoring them. (The JSON exporter does not draw — it
faithfully serialises every field — so it is exempt from this negotiation.)
| Style key | matplotlib | plotly | three.js |
|---|---|---|---|
color |
✓ | ✓ | ✓ |
linewidth |
✓ | ✓ | ✓ |
markersize |
✓ | ✓ | ✓ |
alpha |
✓ | ✓ | ✓ |
zorder |
✓ | ✓ | ✓ (→ renderOrder) |
linestyle |
✓ | ✓ | — |
marker (shape) |
✓ | ✓ | — (points only) |
cmap |
✓ | ✓ | — (fixed ramp) |
fill, fillalpha |
✓ | ✓ | — |
The notable gaps:
- three.js does not honor
linestyle, marker shape, or an arbitrarycmap— it draws solid lines, points (size honored, shape not), and a fixed built-in colour ramp. fill/fillalphaapply toAREAmarks (a band, a filled region) only.
When a backend would drop something, it tells you — in one message per render, listing the dropped keys alphabetically:
>>> import warnings
>>> import tsdynamics as ts
>>> spec = ts.plot(ts.systems.Lorenz(ic=[1.0, 1.0, 1.0])).style(
...     linestyle="dashed", marker="square", cmap="viridis"
... )
>>> with warnings.catch_warnings(record=True) as w:
...     warnings.simplefilter("always")
...     _ = spec.render("threejs")
>>> str(w[0].message)
'threejs: ignoring cmap, linestyle, marker'
The one message also covers any unhonored animation knobs and theme fields for the chosen backend, so degradation is always visible and named, never silent. Render the same spec on matplotlib or plotly and it draws all three knobs with no warning at all. You can introspect a key's reach up front:
>>> sorted(ts.viz.STYLE_KEYS["linestyle"].honored_by)
['matplotlib', 'plotly']
>>> sorted(ts.viz.STYLE_KEYS["color"].honored_by)
['matplotlib', 'plotly', 'threejs']
For a fully portable figure (including three.js), prefer color / linewidth /
markersize / alpha / zorder, which every backend honors.
Upgrading from v3 — breaking changes
The v5 redesign makes the style vocabulary a closed, validated set. Calls that
silently worked on the old v3 matplotlib path — because they were forwarded
straight to matplotlib — now go through normalize_style and raise a ValueError
at the call site if the value is not in the canonical vocabulary. This is
deliberate: the same spec must render the same on plotly and the three.js / JSON
exporters, so a knob only matplotlib understands cannot be allowed through. The
trade is a louder upgrade for a portable, predictable spec.
# skip-doctest — the first call deliberately shows what now RAISES
# v3 — forwarded to matplotlib, silently accepted
spec.style(marker="v", linestyle=(0, (3, 1)), alpha=1.5, zorder=2.0)

# v5 — each of these raises ValueError; map to the canonical set
spec.style(marker="triangle", linestyle="dashed", alpha=1.0, zorder=2)
Markers — canonical shapes only
marker is the canonical set circle, square, triangle, diamond, cross,
x, star, none, plus the single-character aliases o s ^ D + x *. The
matplotlib-only spellings with no canonical equivalent now raise:
| v3 matplotlib marker | v5 — use instead |
|---|---|
'v', '<', '>' (oriented triangles) |
"triangle" |
'^' |
"triangle" (kept as an alias — still works) |
'd' (thin diamond) |
"diamond" |
'8' (octagon) |
"circle" (nearest) |
'P' (filled plus) |
"cross" |
'p', 'h', 'H' (pentagon / hexagons) |
"star" or "circle" (nearest) |
This is a cross-backend choice: three.js and the JSON exporter cannot render
oriented or exotic matplotlib markers, so the vocabulary is restricted to shapes
every visual backend can draw (or honestly decline). It is a hard error rather
than a silent substitution — a quiet down-triangle → up-triangle swap would
corrupt a figure more confusingly than a clear ValueError naming the unknown
marker.
Linestyles — named set only
linestyle is the named set solid, dashed, dotted, dashdot, plus the
short aliases - -- : -.. The matplotlib dash-tuple form (e.g.
(0, (3, 1, 1, 1))) now raises — pick the nearest named style:
# skip-doctest — the first line deliberately shows what now RAISES
spec.style(linestyle=(0, (5, 2)))   # v3 — raises ValueError now
spec.style(linestyle="dashed")      # v5
Range / type checks
Values are now coerced and range-checked, so out-of-range or wrong-typed values v3 tolerated raise:
alpha/fillalphamust lie in[0, 1]— v3 toleratedalpha > 1(matplotlib clamped it).linewidth/markersizemust be≥ 0.zordermust be an integer — a float2.0raises (v3 silently floored it viaint(...)); a NumPy integer is accepted.- A
boolis rejected where a magnitude is expected (alpha=True,linewidth=True).
Unknown keys — including a near-miss typo like colour= — are not a fatal
error: they are dropped with a single VisualizationDegraded warning naming the
offending key(s) (see Unknown keys warn,
above), so the silent no-op of v3 (colour='red' did nothing) is gone.
Interaction with filterwarnings = ["error"]
This repo's own pytest policy is filterwarnings = ["error"] — every warning
becomes an exception — and a fair number of downstream projects run the same
strict policy. Under it, the two warning paths the styling layer adds turn
into errors:
- An unknown style key.
.style(unknown_key=...)(or anynormalize_stylecall that drops a key) emits aVisualizationDegraded. With warnings as errors,.style(colour="red")raises instead of warning-and-dropping. - An unhonored knob at render time. Rendering a spec that sets a knob the
chosen backend cannot honor (e.g.
linestyleon three.js) emits the consolidatedVisualizationDegradeddescribed above — which becomes an error under the strict policy.
There are no false positives on a default render: a spec that sets only honored knobs (or no style at all) emits nothing, so the strict policy never fires on an ordinary plot. Only specs that set an unknown key or an unhonored knob are affected — exactly the cases the warning is meant to flag.
If a downstream test treats warnings as errors and you want the degraded path
(you know three.js drops linestyle, say), scope the warning rather than
loosening your global policy. The warning class is
tsdynamics.viz.render.caps.VisualizationDegraded:
import warnings
from tsdynamics.viz.render.caps import VisualizationDegraded

# 1. Swallow it locally
with warnings.catch_warnings():
    warnings.simplefilter("ignore", VisualizationDegraded)
    spec.style(linestyle="dashed").render("threejs")
# 2. Assert it in a test (pytest), which also consumes it so it can't escalate
import pytest

with pytest.warns(VisualizationDegraded):
    spec.style(colour="red")            # the typo path
# 3. Or down-grade just this class in pyproject.toml / pytest.ini
[tool.pytest.ini_options]
filterwarnings = [
    "error",
    "ignore::tsdynamics.viz.render.caps.VisualizationDegraded",
]
Prefer the narrowest scope that fits — catch_warnings / pytest.warns around
the one call, not a project-wide ignore — so a genuinely-unintended degradation
still surfaces everywhere else.
Introspection
The whole styling surface is discoverable from tsdynamics.viz:
| Entry point | What it gives |
|---|---|
ts.viz.STYLE_KEYS |
the canonical vocabulary — name → StyleKey (each with aliases, honored_by, validate, doc) |
ts.viz.normalize_style |
the alias / validation / unknown-key choke point |
ts.viz.themes.names() |
sorted names of all registered themes |
ts.viz.themes.get() / ts.viz.themes.use() |
read / write the active global default |
ts.viz.themes.register() |
add a named theme |
ts.viz.Theme |
the theme dataclass |
>>> import tsdynamics as ts
>>> sorted(ts.viz.STYLE_KEYS)
['alpha', 'cmap', 'color', 'fill', 'fillalpha', 'linestyle', 'linewidth', 'marker', 'markersize', 'zorder']
>>> key = ts.viz.STYLE_KEYS["markersize"]
>>> key.aliases, key.doc
(('ms', 's'), 'marker size (pt)')
ts.viz is bound lazily — a plain import tsdynamics pulls in no plotting
library — so reach the styling API through the ts.viz namespace (it resolves and
caches on first access).
See also
- Visualization overview — the
PlotIR, the front doorts.plotgrammar, and the renderer catalogue these styles apply to - Animation — the animation modifiers
(
.animate/.trail/.head/.camera/.clock) that chain with these tweaks, and the honoring gaps for the web exporter - Lyapunov spectra — an example of a result that
describes itself as a stylable
Plot
References
- B. Wong, "Points of view: Color blindness", Nature Methods 8 (2011) 441
— the colourblind-safe palette used by the
publicationtheme.