Analysis · Lyapunov spectra
Lyapunov spectra
The Lyapunov exponents are the sharpest number a dynamical system will give you. Two trajectories that start infinitesimally apart separate, on average, at an exponential rate; the spectrum \(\lambda_1 \ge \lambda_2 \ge \dots\) collects those rates, one per direction in tangent space. A single positive exponent is the working definition of chaos — nearby states pull apart, so long-term prediction is impossible even though the equations are deterministic. The signs of the whole spectrum read like a fingerprint: how many directions expand, how many are neutral, how fast phase-space volume contracts onto the attractor.
TSDynamics computes the spectrum three ways — one per family — behind a single uniform verb, plus a Jacobian-free maximal estimate, a from-a-recording estimator, and the Kaplan–Yorke dimension that falls straight out of the numbers.
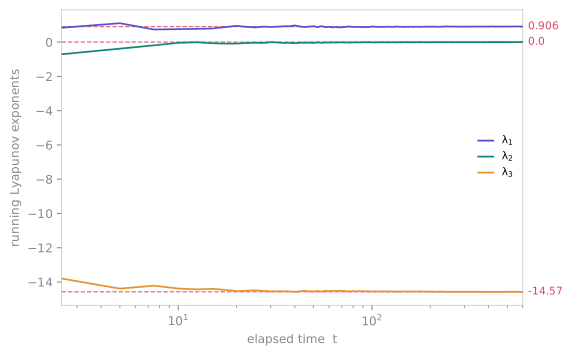
[0.906, 0.0, -14.57] (rose, dashed) on a log-time axis — the positive · zero · strongly-negative signature that certifies a chaotic dissipative flow.The uniform entry point
ts.analysis.lyapunov_spectrum(system, ...) dispatches to the right family
implementation and translates one signature to each family's native keywords.
The exponents come back largest first, in a LyapunovSpectrum result that is a
drop-in for the bare exponent array — np.asarray(result), indexing and
iteration all defer to it — while also carrying .meta and the .kaplan_yorke
dimension. The repr is the report: print it and you get the numbers, the
verdict and the subject on one line.
import numpy as np
import tsdynamics as ts

spec = ts.analysis.lyapunov_spectrum(ts.systems.Lorenz(ic=[1.0, 1.0, 1.0]),
                            final_time=300.0, dt=0.05, transient=40.0)
np.asarray(spec)      # ≈ [ 0.903,  0.002, -14.572]
spec.kaplan_yorke     # ≈ 2.06
print(spec)
# LyapunovSpectrum  λ = [0.9081, -0.001005, -14.57]   chaotic · D_KY = 2.062   (Lorenz)
The keywords split cleanly by family: a flow (ODE or DDE) uses
final_time= as its averaging window and transient= as a burn-in time; a
map uses n= iterations and takes no transient (the QR iteration
reorthonormalises from the initial condition). k= sets how many exponents to
compute (dim by default). Passing a map keyword to a flow — or the reverse —
raises rather than silently doing the wrong thing.
Per family — what actually runs
Under the one verb, each family has a genuinely different tangent-space computation. The call is the same free function every time; only the keywords that make sense for that family change.
lor = ts.systems.Lorenz(ic=[1.0, 1.0, 1.0])
ts.analysis.lyapunov_spectrum(lor, final_time=300.0, dt=0.05, transient=40.0)
# ≈ [0.908, -0.001, -14.57]
The extended variational system — the state plus \(k\) deviation
vectors, whose dynamics are the right-hand side differentiated
symbolically — is integrated on the Rust engine. After the burn_in the
evolving frame is periodically QR-reorthonormalised (Benettin et al.
1980); the logs of the diagonal \(R\) factors, time-weighted, are the
exponents. One exponent of a flow is always \(\approx 0\) — the neutral
direction along the flow — which is why the Lorenz middle exponent lands
just above zero rather than exactly on it.
A single forward pass on the compiled tangent-map kernel: at each iterate the analytic Jacobian is applied to the deviation frame, which is QR-reorthonormalised, and the logs of \(|\mathrm{diag}\,R|\) accumulate. The whole QR iteration runs in one Rust call, and divergent random initial conditions are retried automatically. The exponents are per iteration, not per unit time.
mg = ts.systems.MackeyGlass()
hist = lambda s: [1.0 + 0.1 * np.sin(0.2 * s)]
traj = mg.run(final_time=1000.0, dt=0.5, history=hist)   # settle first
ts.analysis.lyapunov_spectrum(mg, k=1, dt=0.5, ic=traj.y[-1],   # then measure
                              transient=100.0, final_time=1000.0,
                              rtol=1e-4, atol=1e-4)
# ≈ [0.0075]   (positive → chaotic at τ = 17)
A delay system has an infinite-dimensional tangent space (its state is
a history function), so the estimator builds an extended DDE — the base
state plus \(k\) deviation states obeying the symbolic variational dynamics —
and Benettin-renormalises over the deviation history segment. Because it
restarts from a constant past, the workflow is two calls: integrate to
the attractor, then hand the end state to lyapunov_spectrum. A DDE may
request more exponents than dim. The loose 1e-3-ish tolerances are the
DDE default and are the right starting point — the method of steps lands on
every output sample, so dt bounds the internal step and tightening mostly
buys nothing (it is safe, just not usually worth it). See
the tolerance table.
Every call records its settings in result.meta — the horizon it actually used,
the family, the parameters and the initial condition.
Reading the signs — and when the result refuses to read them
The number of positive exponents names the dynamics: none → regular (a fixed point, cycle or torus), one → chaos, two or more → hyperchaos. The repr prints that word, but only when it is earned.
The zero tolerance is calibrated on the estimator's own realised zero: a
flow has at least one structurally-zero exponent, so min|λ| measures how
close to zero this estimator got at this horizon — which is exactly the
tolerance the classification needs. A map has no structural zero and keeps a
relative floor. The supporting line shows which rule ran and at what floor:
LyapunovSpectrum  λ = [0.9081, -0.001005, -14.57]   chaotic · D_KY = 2.062   (Lorenz)
    (3 exponents · flow (realised zero) · λ > 0.0146)
If the count changes when that floor is multiplied by ten, no word is
printed — the result says indeterminate at this horizon (n_pos = 0..1
across a 10x tolerance band; raise final_time) instead of guessing. And
D_KY is suppressed entirely when no exponent is positive, because on a
regular spectrum it is just the integer state dimension and printing it
would read as a measurement.
Known values to test against
These are literature numbers you can reproduce with the calls above — the same
ones the bulk test suite checks continuously for every system that declares a
known_lyapunov class attribute.
| System | Spectrum | Note |
|---|---|---|
| Lorenz (defaults) | [0.906, 0, -14.57] |
one zero exponent along the flow |
| Hénon (defaults) | [0.42, -1.63] |
$\sum\lambda_i \approx \ln |
Logistic, r = 4 |
[ln 2 ≈ 0.693] |
exact analytic result |
Mackey–Glass, τ = 17 |
leading > 0 |
chaotic; \(\ge 1\) positive exponent |
Just the leading exponent — and no Jacobian required
Ask for one exponent, and you get one:
ts.analysis.lyapunov_spectrum(ts.systems.Lorenz(), k=1, ic=[1.0, 1.0, 1.0])
ts.analysis.lyapunov_spectrum(ts.systems.Henon(), k=1, ic=[0.1, 0.1])
max_lyapunov is gone — one question, one spelling
Until v6 there was a second door, max_lyapunov, onto exactly this
question, and the two answered it with different numbers: on Hénon at
one nominal horizon max_lyapunov said 0.4233 and lyapunov_spectrum
said 0.4160. The better half of it — the burn-in, and the Jacobian-free
two-trajectory machine — moved into lyapunov_spectrum, and the second door
closed. The old name raises, naming this one.
When the system has a right-hand side to differentiate, the exponents come from
a tangent frame carried alongside the orbit: nothing is perturbed and
nothing is rescaled. When it does not — a
WrappedSystem around an external stepper, a
non-smooth map with no analytic Jacobian — lyapunov_spectrum falls back to the
classic two-trajectory method, which needs nothing but the stepping
protocol: run a reference and a copy perturbed by d0, let them separate for
steps_per protocol steps, log the growth \(\ln(d/d_0)\), rescale back to d0,
and repeat (Benettin, Galgani & Strelcyn 1976). The continuous normalisation
divides by the measured elapsed time() of the reference run, so the exponent
is correct whatever per-step advance the system makes.
lyapunov_from_data — from a measured series
Given a recording but no equations, the maximal exponent can be estimated from
how fast neighbours diverge inside a delay embedding. The signal is
reconstructed in a dimension-dimensional delay embedding (Takens 1981); for
every reference point its neighbours are found and the mean log distance
between their forward images is tracked as a function of the look-ahead \(k\).
The result carries the full stretching curve \(S(k)\) — the exponent is the
slope of its linear scaling region.
traj = ts.systems.Henon().run(6000, transient=500, ic=[0.1, 0.1])
res = ts.analysis.lyapunov_from_data(traj.y[:, 0], dimension=4, k_max=12, fit=(0, 6))

float(res)          # ≈ 0.42   (Hénon, per iteration)
res.times, res.divergence     # the S(k) curve — inspect, then set fit=(lo, hi)
Two estimators are available via method=:
"kantz"(default) averages over all neighbours within a ball of radiuseps— robust to noise (Kantz 1994)."rosenstein"tracks the single nearest neighbour — cheaper, well-suited to short records (Rosenstein, Collins & De Luca 1993).
A Theiler window rejects temporally-correlated neighbours (Theiler 1986), defaulting to the embedding span.
The exponent is reported per unit of dt, and dt is read from the data
when the data knows it: hand the estimator a Trajectory and it uses that
trajectory's own sampling interval, so the number is directly comparable with
lyapunov_spectrum. Hand it a bare array — which carries no time axis — and it
stays per sample, which is also the right reading for a map (per iteration).
Pass dt= explicitly to override either way.
Inspect the curve before you trust the number
The estimate is only as good as the embedding and the chosen scaling
region. For flows the divergence curve typically overshoots before it
settles into the genuine linear region, so the automatic fit can
overestimate. Always look at res.times vs res.divergence and pass an
explicit fit=(lo, hi) before quoting a publishable value.
Kaplan–Yorke dimension
The Lyapunov (Kaplan–Yorke) dimension estimates the attractor's fractal dimension straight from the spectrum — no box-counting required:
with \(j\) the largest index whose cumulative exponent sum is still non-negative
(Kaplan & Yorke 1979) — the interpolation point where expanding directions have
just been balanced by contracting ones. It returns 0.0 for a fully negative
spectrum (a fixed point) and len(spectrum) when the cumulative sum never turns
negative (the spectrum does not close — compute more exponents). A
LyapunovSpectrum exposes it directly as spec.kaplan_yorke.
TangentSystem — build your own loop
When the prepackaged routines do not fit — covariant vectors, finite-time exponents, custom convergence monitoring — the tangent system exposes the tangent machinery as a steppable system, so you own the loop:
from tsdynamics.derived import TangentSystem

tang = TangentSystem(ts.systems.Henon(), k=2)     # k deviation vectors
tang.reinit([0.1, 0.1])
for _ in range(5000):
    tang.step()
tang.exponents()      # running spectrum estimate ≈ [0.43, -1.63]
tang.growths()        # per-step log stretch factors
It is the single Lyapunov engine underneath every routine above: maps run the
compiled QR tangent-map kernel, ODEs integrate the extended variational system on
the engine, and DDEs are excluded (their tangent space is infinite-dimensional —
use lyapunov_spectrum). It is exactly the object the showcase figure at the top
of this page is built from.
See also
- Chaos indicators — GALI, the 0–1 test and expansion entropy: fast "is it chaotic?" verdicts that stand in for the full spectrum
- Fixed points & periodic orbits — the invariant sets whose local stability the exponents generalise
- Fractal dimensions — measure the attractor's dimension directly, to cross-check \(D_{KY}\)
- Delay embeddings — the reconstruction
lyapunov_from_datarelies on - Integration & methods — the solver and backend
lyapunov_spectrumruns on
References
- G. Benettin, L. Galgani & J.-M. Strelcyn, "Kolmogorov entropy and numerical experiments", Phys. Rev. A 14 (1976) 2338.
- G. Benettin, L. Galgani, A. Giorgilli & J.-M. Strelcyn, "Lyapunov characteristic exponents … a method for computing all of them", Meccanica 15 (1980) 9 & 21.
- J. L. Kaplan & J. A. Yorke, in Functional Differential Equations and Approximation of Fixed Points, LNM 730, Springer (1979) 204.
- H. Kantz, "A robust method to estimate the maximal Lyapunov exponent of a time series", Phys. Lett. A 185 (1994) 77.
- M. T. Rosenstein, J. J. Collins & C. J. De Luca, "A practical method for calculating largest Lyapunov exponents from small data sets", Physica D 65 (1993) 117.