Start · 02
First trajectory
Every workflow in TSDynamics starts the same way: pick a system, run it, and work with the result. This page walks the whole loop for the Lorenz attractor — instantiate, run, read components, plot, and quantify — then does the same for a discrete map. A dozen lines end to end.
Instantiate a system
Built-in systems live under tsdynamics.systems. Each is a class you
instantiate with its parameters; the defaults reproduce the textbook attractor.
Override any parameter by keyword — ts.systems.Lorenz(rho=35.0) — or set an
initial condition with ic=[...]. Leaving ic unset lets the library pick a
sensible starting point.
ts.systems.Lorenz, not ts.Lorenz
The top level is seventeen names; every built-in system lives under
ts.systems. Typing ts.Lorenz raises an error that hands you the address:
Run it
run is the one verb that produces data — on flows, delay systems, maps and
SDEs alike. It returns a single
Trajectory.
traj = lor.run(final_time=100.0, dt=0.01)

traj.t.shape      # (10001,)   — the time grid
traj.y.shape      # (10001, 3) — state at each time
dt is only the output grid — where the solution is sampled into the
returned arrays. The internal solver is adaptive, choosing its own steps to meet
the error tolerances, so a coarse dt costs resolution but never accuracy. The
right-hand side is lowered to the Rust engine in-process and JIT-compiled to
native code on first use — both steps happen in milliseconds and are memoised, so
there is no build step to wait for and nothing is written to disk.
Prefer explicit control? Pass solver=, rtol=/atol=, ic=, max_step= or a
backend=. All of that is covered in
Integration & methods.
solver= picks a numerical kernel; method= picks an estimator
One concept, one spelling. lor.run(solver="dop853") chooses the
integration kernel; ts.analysis.optimal_delay(x, method="mi") chooses an
estimation algorithm. Passing method= to run raises and says so.
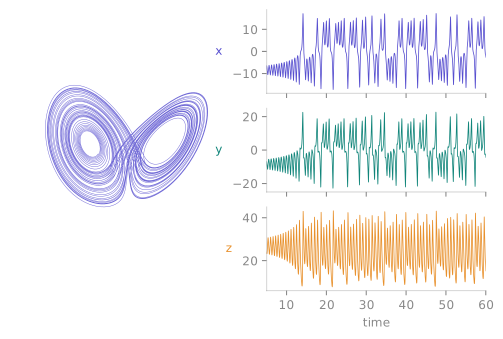
x(t), y(t), z(t) component series (right) — two views of one Trajectory.Read named components
Because Lorenz declares variables = ("x", "y", "z"), the trajectory knows
its components by name. Index it like a dictionary of channels, slice off a
transient, or unpack it into (t, y) arrays:
x    = traj["x"]              # (10001,)   — one named component
xz   = traj["x", "z"]         # several, in order → a Trajectory naming x and z
tail = traj.after(20.0)       # drop the transient before t = 20
t, y = traj.t, traj.y         # the two arrays: (10001,) and (10001, 3)
Strings select columns, everything else selects rows — the pandas grammar.
traj[10:50], traj[::5] and traj[mask] all give you a trajectory back.
traj.y is the whole state array; traj[\"y\"] is the component named y
traj.y has shape (T, dim); traj["y"] has shape (T,). Two characters
apart on more than a hundred catalogue systems, so the repr prints both.
(Note also that traj.y is the transpose of SciPy's
solve_ivp(...).y, which is (dim, T). Every comparison in these docs
writes sol.y.T.)
Iterating a trajectory yields one (t, state) pair per sample, and len(traj) is
the number of samples — so len() and iteration agree, as they should for any
Python container.
The trajectory also carries its full provenance in traj.meta — the system, its
parameters, the solver, dt, tolerances, the initial condition, and the library
version — and that metadata survives slicing.
Plot it
With a plotting backend installed (pip install "tsdynamics[viz]") one verb
draws anything you hand it. ts.plot auto-dispatches on how many components you
select — one is a time series, two a 2-D phase portrait, three a 3-D one — and
returns a Plot you can save, style or compose:
# skip-doctest — .save() writes a file and needs the optional tsdynamics[viz] backend
ts.plot(traj).save("lorenz.png")                     # 3-D phase portrait
ts.plot(traj, components="x").save("x.png")          # a single-component series
ts.plot(traj, color="crimson", title="Lorenz")       # styled at the door
A positional string says how to draw; everything else says what to draw —
so ts.plot(traj, "psd") is the power spectrum of that orbit, and
ts.plot(traj_a, traj_b, "phase_portrait") is both orbits on one pair of axes.
The whole plotting layer — grids, primitives, themes, animation — is documented
under Visualization.
Quantify: the Lyapunov spectrum
Every analysis is a free function whose first argument is the thing it is about. The payoff of having the symbolic equations is that the analysis is exact: the Lyapunov spectrum — the average exponential rates at which nearby trajectories separate — comes straight from the variational equations, with no finite differences.
For a well-converged estimate, run for longer. The result prints its own answer:
print(ts.analysis.lyapunov_spectrum(lor, final_time=500.0, dt=0.05))
# LyapunovSpectrum  λ = [0.9137, -0.0001274, -14.58]   chaotic · D_KY = 2.063   (Lorenz)
One positive exponent, one near-zero (the direction along the flow), one
strongly negative — the positive/zero/negative signature that certifies a
chaotic attractor. The verdict word is only printed when it survives a tenfold
change of the zero tolerance; otherwise the result says indeterminate at this
horizon instead of guessing.
Feed the spectrum to the Kaplan–Yorke formula for a fractal-dimension estimate — an analysis whose subject is another analysis's answer:
spectrum = ts.analysis.lyapunov_spectrum(lor, final_time=500.0, dt=0.05)
ts.analysis.kaplan_yorke_dimension(spectrum)
# ≈ 2.06
The Lyapunov page covers the full spectrum, the Jacobian-free maximal estimator, and estimation from a bare measured series.
The same loop for a map
A map has no time: its independent variable is an integer index, so the same
run verb takes a number of steps rather than a final_time, and returns the
same Trajectory.
h = ts.systems.Henon()                        # a=1.4, b=0.3
orbit = h.run(steps=5000, ic=[0.1, 0.1])
orbit.t                                       # array([0, 1, 2, ...]) — step indices
orbit.y.shape                                 # (5000, 2)

ts.analysis.lyapunov_spectrum(h, n=5000, ic=[0.1, 0.1])   # ≈ [0.42, -1.62]
Ask for the wrong horizon word and the error names the mathematics, not just the signature:
InvalidParameterError: final_time is not a valid Henon.run() keyword, got 10.0.
final_time is a *flow* keyword: a map has no continuous time — its horizon is a
count of iterations.
    Henon().run(steps=1000)
The map spectrum is computed by a QR decomposition of the Jacobian product in a single forward pass on the engine. Everything downstream — the trajectory object, named components, the analysis toolkit — behaves exactly as it does for a flow.
Give a map an explicit initial condition
A random start can land in a divergent basin; the library retries from a new
random point if that happens, but passing a known-good ic=[...] (as above)
keeps a worked example reproducible and warning-free.
Next
03 · The mental model — the four families, the one stepping protocol every system shares, and the derived wrappers that turn a flow into a map.