Visualization
Composition
A single subject describes one panel. Real figures — a
before/after pair, a small-multiples grid of attractors, two state variables
stacked over a shared time axis — are arrangements of panels. ts.viz.plot
is the figure-level front door that does the arranging.
Its defining property is that it is closed over Plot: it takes
plottables (a Trajectory, a system, an analysis
result) or already-built specs, and it returns a Plot. Because the input
type and the output type are the same, a plot(...) result feeds straight back
into plot(...) — you build each panel with one flat call, then arrange the
panels with another. The result renders itself: .plot(), .save(path),
.render(backend=), and a notebook display hook, exactly like a single-panel
spec.
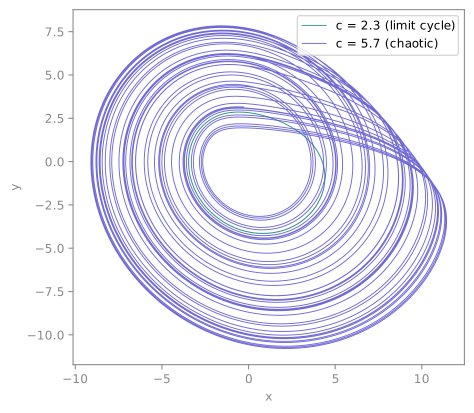
c = 2.3 and the wide indigo chaotic band at c = 5.7 — merged onto one set of (x, y) axes with layout="overlay". The legend is auto-disambiguated by source, since both panels came from a system named "Rossler".The one verb
import tsdynamics as ts

# skip-doctest — the signature, not a runnable call (`things` is your inputs)
ts.plot(*things, layout="overlay", animate=False, **build_kw)  # -> Plot
*things— any mix of plottables and already-builtPlotobjects. A single list/tuple argument is unwrapped, soplot([a, b])andplot(a, b)are the same.layout—"overlay"(default) draws everything on one set of axes;"stack"/"row"/"grid"give each thing its own panel in aCOMPOSITEfigure.build_kw—components=,kind=, and the per-kind options are forwarded to each subject as it is drawn, soplot(a, b, components="x")composes the same view of each.build_kwcannot be combined with an already-builtPlotargument (you passed the build options when you first built it) — mixing the two raisesInvalidParameterError.animate— animate the whole figure (see Animating a figure).
Overlay: many drawables, one set of axes
layout="overlay" (the default) merges compatible single-panel specs onto one
panel. It is the right layout when the drawables share a coordinate frame — two
orbits in the same phase plane, several state variables over the same time axis,
a trajectory and a coarser-dt rerun of it.
The overlay figure above is one call:
import tsdynamics as ts

r_cycle = ts.systems.Rossler().with_params(c=2.3)   # a small limit cycle
r_chaos = ts.systems.Rossler().with_params(c=5.7)   # the classic chaotic band
ic = [0.1, 0.0, 0.0]

t_cycle = r_cycle.run(final_time=200.0, dt=0.05, ic=ic)
t_chaos = r_chaos.run(final_time=200.0, dt=0.05, ic=ic)

fig = ts.plot(t_cycle, t_chaos, components=["x", "y"])
fig.recolor("#11857A", "#574FCF").save("compose-overlay.svg")
>>> fig.kind
<PlotKind.PHASE_PORTRAIT_2D: 'phase_portrait_2d'>
>>> len(fig.layers)              # both orbits are layers on one panel
2
>>> [layer.label for layer in fig.layers]
['Rossler (1)', 'Rossler (2)']
>>> fig.meta["composed"]         # the source tags, in order
['Rossler (1)', 'Rossler (2)']
Both sources carry the title "Rossler", so the overlay makes the legend
unambiguous by tagging each Rossler (1) / Rossler (2) and prefixing every
layer label with its source. When the sources have distinct titles the tags
are those titles verbatim (no counter). Give a source a clearer name by
relabelling its spec's title before you compose, or pin it inline:
a = ts.plot(t_cycle, components=["x", "y"]).relabel(title="limit cycle")
b = ts.plot(t_chaos, components=["x", "y"]).relabel(title="chaos")
ts.plot(a, b)   # legend entries: "limit cycle" / "chaos"
What can be overlaid
Only kinds that genuinely share axes may overlay: TIME_SERIES,
PHASE_PORTRAIT_2D, and PHASE_PORTRAIT_3D. Every input must be the same
one of those. Mixing kinds — a time series and a 2-D portrait, or a 2-D and a
3-D portrait — cannot share one set of axes and raises, pointing you at a
panelled layout instead:
>>> lor = ts.systems.Lorenz()
>>> ts_spec = ts.plot(lor, components="x", final_time=40.0, dt=0.01, ic=[1.0, 1.0, 1.0])
>>> ph_spec = ts.plot(lor, components=["x", "y"], final_time=40.0, dt=0.01, ic=[1.0, 1.0, 1.0])
>>> ts.plot(ts_spec, ph_spec)
Traceback (most recent call last):
    ...
tsdynamics.errors.InvalidParameterError: cannot overlay specs of kinds
['phase_portrait_2d', 'time_series'] on one set of axes; use layout='stack'
(or 'row' / 'grid') to give each its own panel.
Image / section / composite kinds (a recurrence plot, a spacetime image, a basin image) each need their own axes and colorbar — they are never overlaid; arrange them into panels.
A single input passes through
plot(one_thing) with one argument returns that thing's spec unchanged
(there is nothing to arrange). This is what lets ts.viz.plot double as a
convenience wrapper — ts.plot(system).save("x.png").
Composite: tiling panels into a figure
layout="stack" / "row" / "grid" build a PlotKind.COMPOSITE spec: each
thing keeps its own axes and becomes one panel, and a
Layout records how to tile them. Every renderer
that draws composites (matplotlib and plotly) maps the Layout.mode to its own
subplot grid.
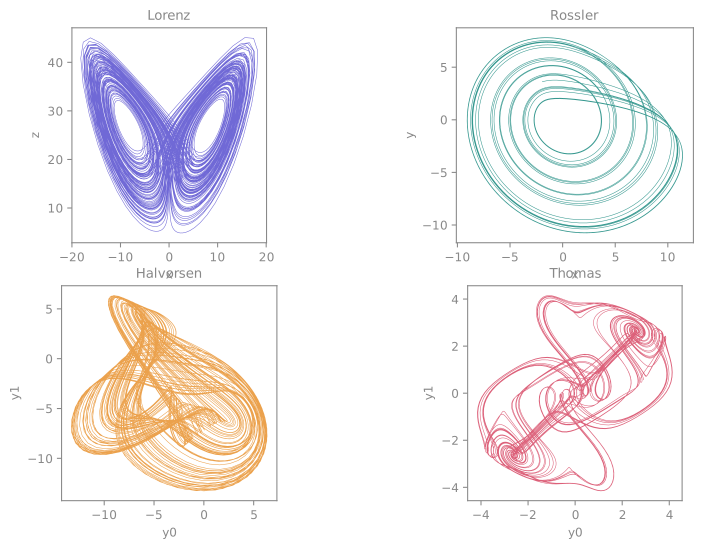
layout="grid". Small multiples like this are the natural way to compare systems side by side — the panels do not share axes, so each attractor keeps its own scale.import tsdynamics as ts
lor, ros, hal, tho = ts.systems.Lorenz(), ts.systems.Rossler(), ts.systems.Halvorsen(), ts.systems.Thomas()
grid = ts.plot(
ts.plot(lor, components=[0, 2], final_time=100.0, dt=0.01, ic=[1.0, 1.0, 1.0]),
ts.plot(ros, components=[0, 1], final_time=200.0, dt=0.05, ic=[0.1, 0.0, 0.0]),
ts.plot(hal, components=[0, 1], final_time=100.0, dt=0.01, ic=[-5.0, 0.0, 0.0]),
ts.plot(tho, components=[0, 1], final_time=300.0, dt=0.05, ic=[1.1, 1.1, -0.01]),
layout="grid",
)
grid.save("compose-grid.svg")
>>> grid.kind
<PlotKind.COMPOSITE: 'composite'>
>>> grid.is_composite
True
>>> len(grid.panels)
4
>>> grid.layout.mode
'grid'
>>> [p.title for p in grid.panels]
['Lorenz', 'Rossler', 'Halvorsen', 'Thomas']
Two of these systems (Halvorsen, Thomas) declare no named variables, so
their components are selected by index ([0, 1]); Lorenz and Rossler
would also accept ["x", "y"]. Selecting by index always works — see
Plotting — the front door.
The three arrangements
layout |
Layout.mode |
Shape |
|---|---|---|
"stack" |
stack |
one column of stacked panels |
"row" |
row |
one row of side-by-side panels |
"grid" |
grid |
a 2-D grid, near-square unless you set rows / cols |
"stack" has one convenience default: when every panel is a TIME_SERIES
that names the same x axis (the canonical "x(t) above y(t) over one shared
time axis" case), the panels auto-share their x axis.
lz = ts.systems.Lorenz()
px = ts.plot(lz, components="x", final_time=40.0, dt=0.01, ic=[1.0, 1.0, 1.0])
py = ts.plot(lz, components="y", final_time=40.0, dt=0.01, ic=[1.0, 1.0, 1.0])

stack = ts.plot(px, py, layout="stack")
Any other arrangement — a row, a grid, or a stack of mixed kinds — keeps
independent axes. To force axis sharing, or to fix an explicit grid shape, build
the Layout by hand and attach it:
from tsdynamics.viz.spec import Layout

grid.layout = Layout(mode="grid", rows=2, cols=2, share_x=True, share_y=True)
Recursion: spec in, spec out
Because a composite is a Plot, you can compose composites — and the rule is
the one the parentheses suggest:
A child composite of the same arrangement is absorbed; a child of a different arrangement becomes a block.
So a stack of stacks is one taller stack, while a stack placed in a row
stays a column occupying one cell of that row. That is what makes
(plot(a) | plot(b)) / plot(c) draw a row of two with c spanning the width
below, instead of three stacked rows. Build the pieces bottom-up and combine:
import tsdynamics as ts

lz = ts.systems.Lorenz()
ic = [1.0, 1.0, 1.0]

# Panel 1: x(t) and y(t) stacked on a shared time axis.
px = ts.plot(lz, components="x", final_time=40.0, dt=0.01, ic=ic)
py = ts.plot(lz, components="y", final_time=40.0, dt=0.01, ic=ic)
timeline = ts.plot(px, py, layout="stack")

# Panel 2: the phase portrait.
portrait = ts.plot(lz, components=["x", "z"], final_time=40.0, dt=0.01, ic=ic)

# Combine — the stack stays a column, beside the portrait.
figure = ts.plot(timeline, portrait, layout="row")
>>> figure.kind, figure.layout.mode
(<PlotKind.COMPOSITE: 'composite'>, 'row')
>>> len(figure.panels)          # the timeline (one block) + the portrait
2
>>> figure.panels[0].layout.mode     # ...and the block is still a stack
'stack'
Pass that same stack into another stack and it is absorbed instead, because a column inside a column is just a longer column:
That one rule — same arrangement absorbs, different arrangement nests — is what
makes | and / compose the way the brackets read.
Animating a figure
animate= (or the chainable .animate() on the result) turns the whole figure
into a movie. A composite plays every panel in lockstep on one master
clock: the composite carries the master Animation, and each panel that is not
already animated gets the same timeline — with its own per-kind head default (a
head marker on portraits and spacetime, off on a plain time series).
import tsdynamics as ts

lor, ros = ts.systems.Lorenz(), ts.systems.Rossler()
comp = ts.plot(
    ts.plot(lor, components=[0, 2], final_time=30.0, dt=0.01, ic=[1.0, 1.0, 1.0]),
    ts.plot(ros, components=[0, 1], final_time=60.0, dt=0.05, ic=[0.1, 0.0, 0.0]),
    layout="row",
    animate=True,
)
comp.animate(fps=30, n_frames=120).save("two-attractors.mp4")
>>> comp.is_animated
True
>>> [p.animation is not None for p in comp.panels]   # every panel plays in lockstep
[True, True]
An animated composite is a matplotlib job (its FuncAnimation drives every panel
on the shared clock); the plotly backend declines an animated composite and
dispatch falls back to matplotlib. See Animation for the full
comet / trail / head / camera vocabulary and the export formats.
Themes across a composite
A composite resolves its theme per panel, in this order:
So to give every panel one look, set the theme on the composite result; to make one panel different, set its theme before you pass it in.
An overlay is a single panel, so it just uses spec.theme or the global default.
See Styling & themes for the full theme system.
Pitfalls
| Situation | What happens |
|---|---|
| Overlaying incompatible kinds (image + portrait, 2-D + 3-D) | Raises InvalidParameterError — use layout="stack" / "row" / "grid". |
build_kw (components=, kind=) with an already-built Plot |
Raises InvalidParameterError — pass build options when you first build the spec. |
| Passing a plain array / a non-plottable | Raises InvalidInputError — wrap it in a Trajectory or build a Plot. |
| Two sources with the same title | Legend tags are auto-disambiguated (Name (1) / Name (2)); relabel a spec's title for clearer entries. |
| Wanting a nested sub-figure | Supported — put a composite of the other arrangement inside ((a \| b) / c). A child of the same arrangement is absorbed. |
| A nested figure on an interactive backend | Plotly declines it and matplotlib draws it, with one VisualizationDegraded — its subplot grid is flat, and it used to drop panels silently. |
| A random-IC system in a snippet | Always pass an explicit ic= (see the front door) so the panel is deterministic. |
See also
- Transforms & primitives — the single-panel views each panel is built from.
- Styling & themes — the fluent tweaks (
recolor/theme/ …) that also chain on a composite result. - Animation — the orthogonal animation modifier, including the lockstep composite movie.
- Backends & export — how the returned spec renders and saves itself, and how composites tile natively in matplotlib and plotly.