Ricker
Systems / Maps / Population maps
The Ricker recruitment map — over-compensatory density dependence driving fishery population cycles and chaos.
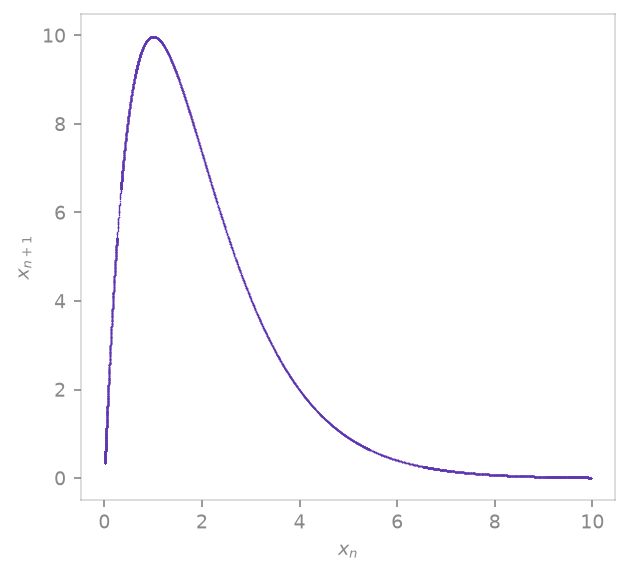
Definition
Parameters
| Symbol | Default | Role |
|---|---|---|
a |
3.3 |
intrinsic growth rate (the bifurcation parameter) |
State variables: x
Properties
Lyapunov spectrum
TODO — lyapunov_spectrum failed: AttributeError
Kaplan–Yorke dimension
TODO — requires a numeric Lyapunov spectrum
Divergence ∇·f
n/a — discrete map — flow divergence undefined (per-step contraction is |det J|)
Equilibria
2 fixed points
0 stable · 2 unstable
0 stable · 2 unstable
Use it in TSDynamics
import tsdynamics as ts

system = ts.systems.Ricker()
traj = system.run(steps=10_000)
ts.plot(traj)

spectrum = ts.analysis.lyapunov_spectrum(system)
ts.analysis.kaplan_yorke_dimension(spectrum)
Reference
Ricker (1954), J. Fish. Res. Board Can. 11, 559-623
doi:10.1139/f54-039