Plotting
import numpy as np
import matplotlib.pyplot as plt
import hilbertplot as hp

t = np.arange(4096)
values = np.sin(2 * np.pi * t / 97) + 0.4 * np.cos(2 * np.pi * t / 31)
fig = hp.plot(values, curve=12)
plt.show()
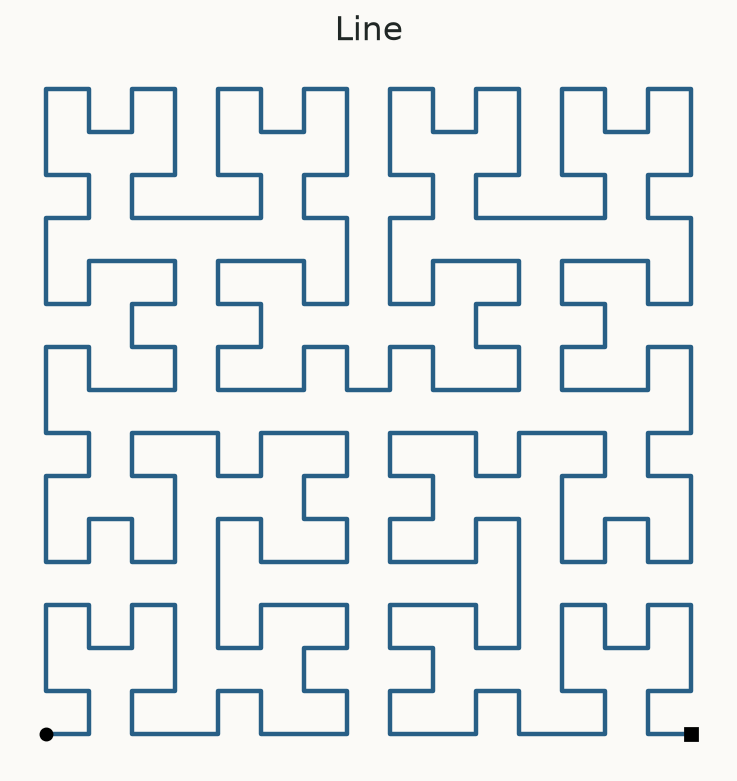
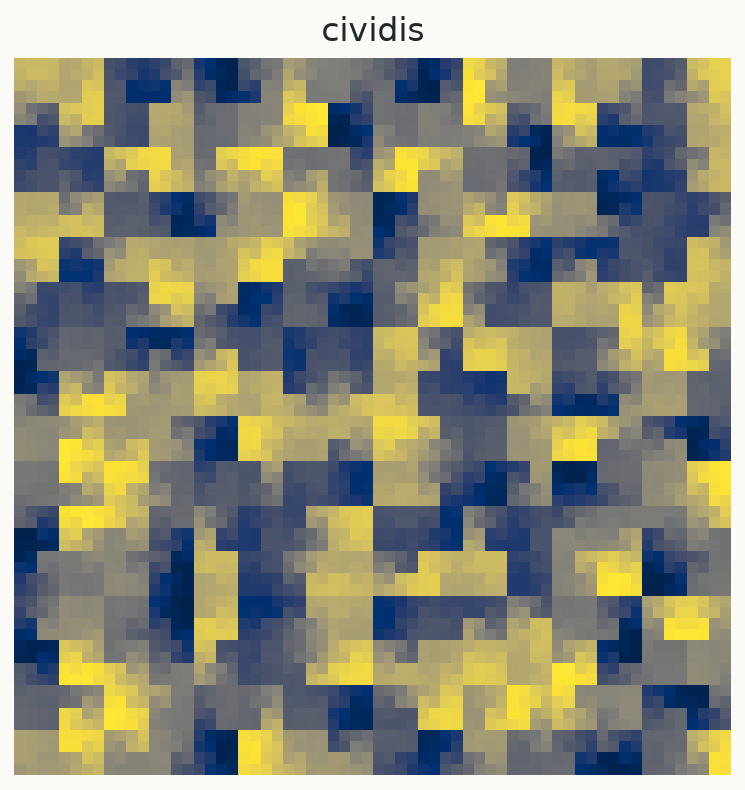
The curve walks through a square grid. Value values[i] goes into the i-th visited
cell. A colour represents the value in that cell. Each call makes one plot.
Choose by number or label
hp.plot(values, curve=0)          # Hilbert, the default
hp.plot(values, curve="Moore")   # a named curve
hp.plot(values, curve="12H")     # a paper symbol
Every catalog entry has an index from 0 through 39. You never need to remember a generated label.
Save the figure
fig = hp.plot(values, curve=12)
fig.savefig("sequence.png", dpi=200)
fig.savefig("sequence.pdf")
plt.close(fig)
Drawing does not call plt.show() or close your figure. In scripts, call plt.show()
after preparing the figures you want. In notebooks, the plotting backend normally displays them.
Colormaps
hp.plot(values, cmap="viridis")
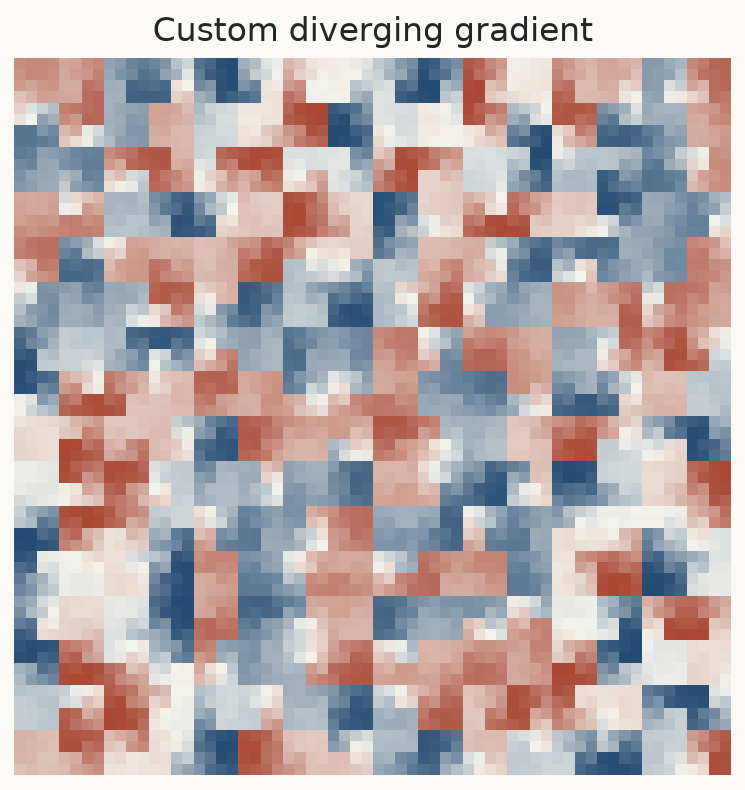
hp.plot(values, cmap=["navy", "white", "firebrick"], vmin=-1, vmax=1)
A colour list defines a smooth gradient: low values use its first colour, middle values pass through the intermediate colours, and high values use its last colour. It does not assign colours to categories.
Color normalization
For positive values with a large dynamic range:
from matplotlib.colors import LogNorm

positive = np.exp(3 * np.sin(t / 37))
hp.plot(positive, cmap="inferno", norm=LogNorm(vmin=np.exp(-3), vmax=np.exp(3)))
Use either norm= or vmin/vmax. When passing a norm, put limits on the norm itself.
Use your own axes
fig, ax = plt.subplots()
hp.plot(values, curve=12, ax=ax, title="My sequence")
A colourbar is enabled by default. Pass colorbar=False to omit it.
Missing values
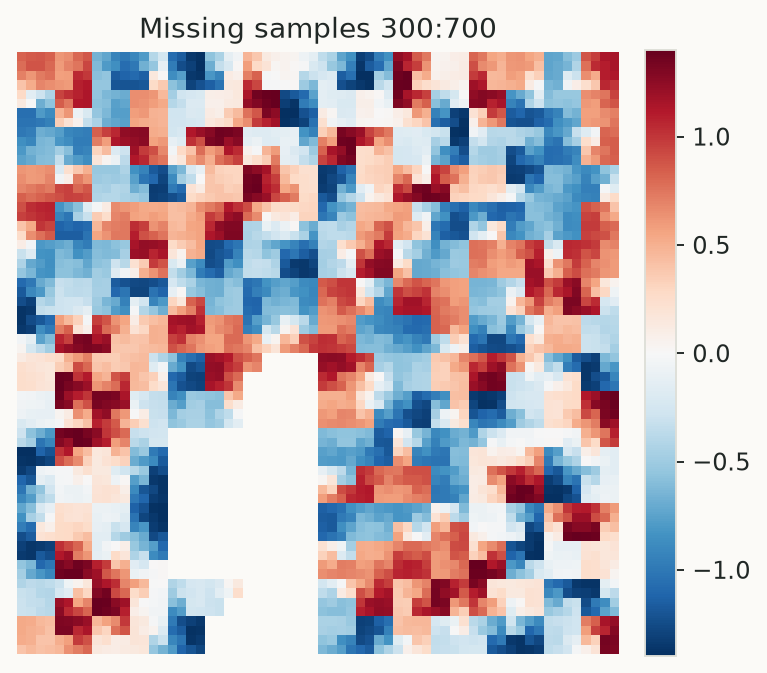
missing = values.copy()
missing[300:700] = np.nan
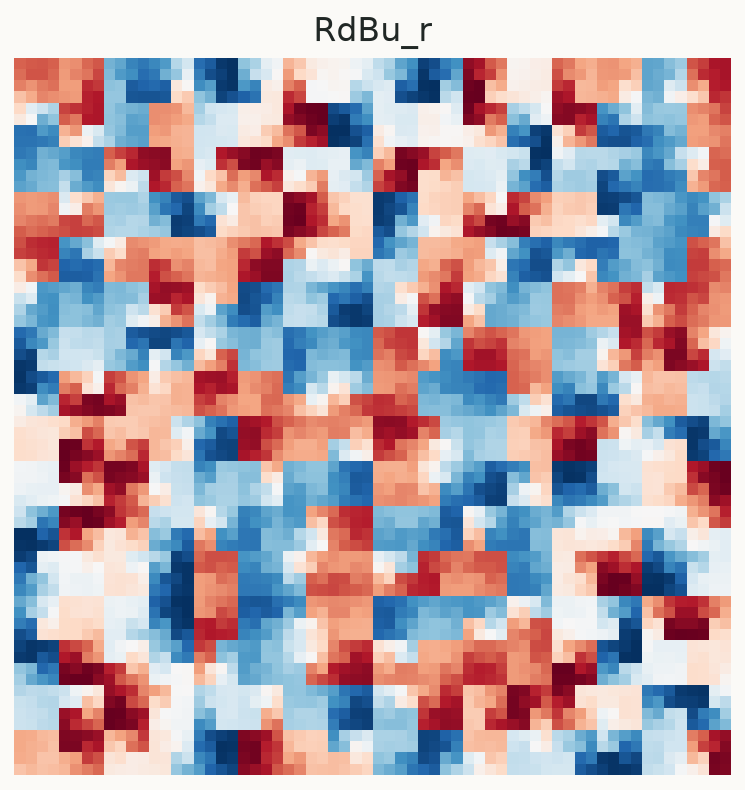
fig = hp.plot(missing, cmap="RdBu_r")
NaNs and masked samples are transparent in the data image. Infinities are rejected. Replace infinities using an explicit policy appropriate to the data before plotting.
Curve rendering
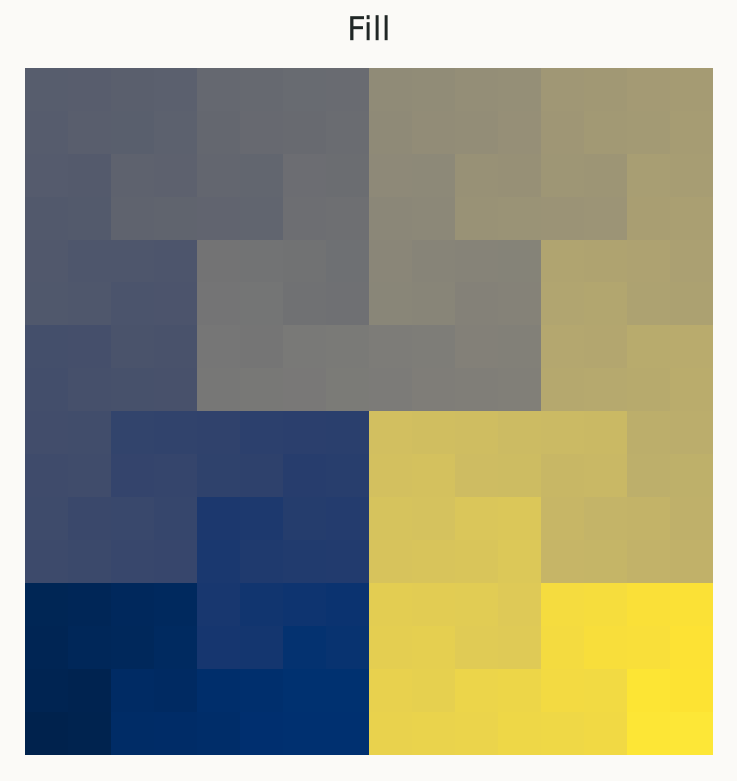
hp.plot_curve() displays a path, rather than measurement values. A solid color=
uses one line color; cmap= colors visit order. mode="fill" colors cells by visit
order. Automatic mode uses lines below order 8 and filled cells at larger orders.