Granularity
Granularity replaces each consecutive block of \(g\) sequence values by repeated copies of that block’s arithmetic mean. It keeps the sequence length fixed. A final short block uses only its available samples.
For a block \(B\) and every \(i\in B\),
This acts in sequence order before mapping. It is not an average over square patches of neighbouring image pixels, and it is not downsampling.
Periodic regions from the README
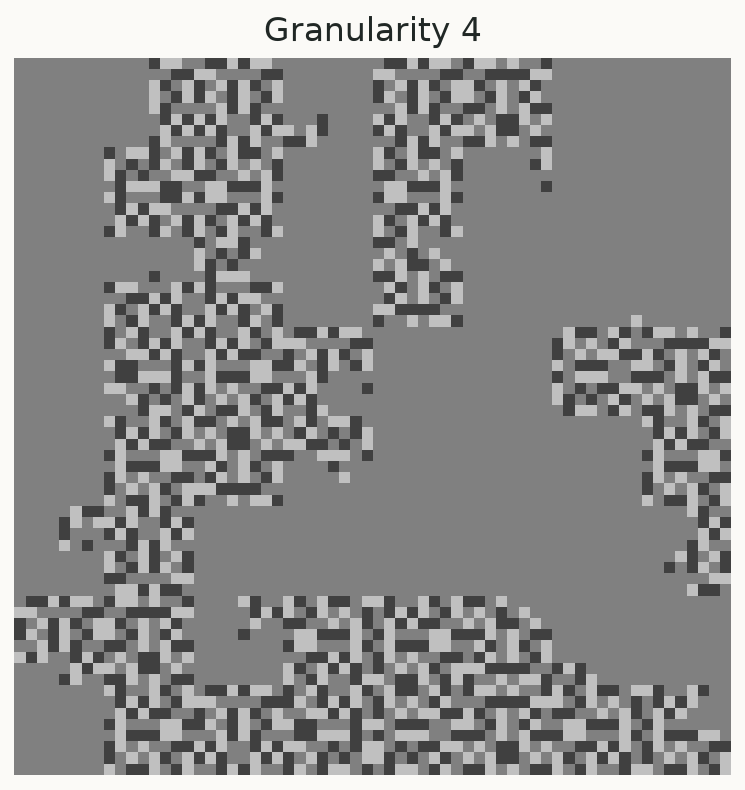
This example uses the same generator, seed (3), length (\(4^7=16,384\)), and granularity
(4) as examples/readme_figures.py.
The sequence interleaves runs of [1,0,0,1] (period 4) and [1,1,0,1,0,0] (period 6).
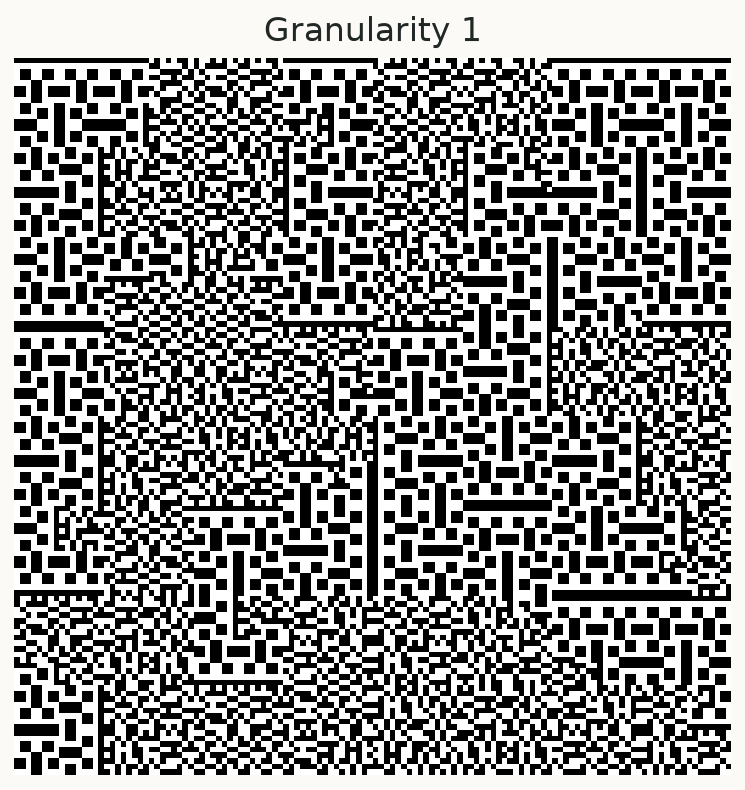
Both have mean 1/2, so the unaveraged plot does not distinguish the runs by brightness.
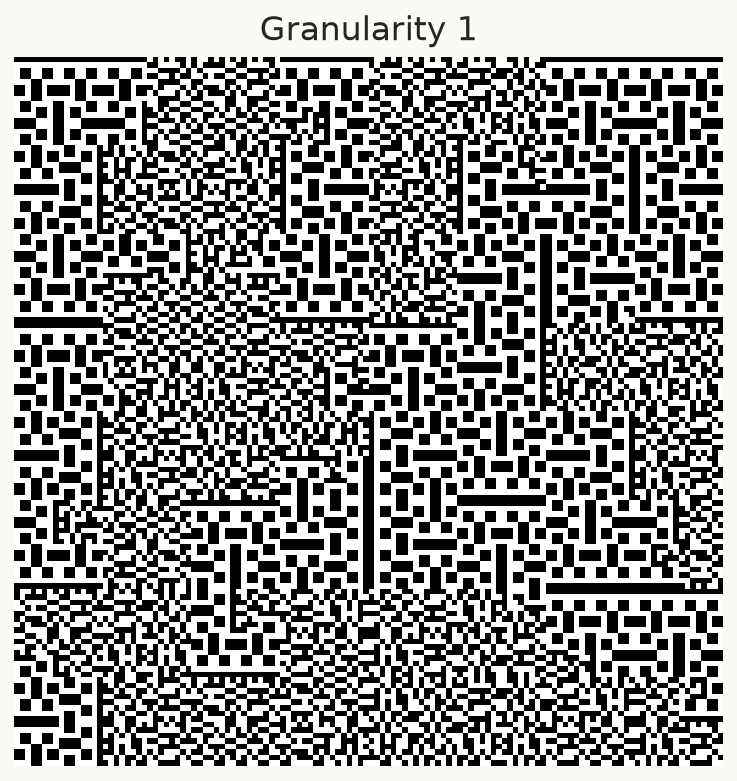
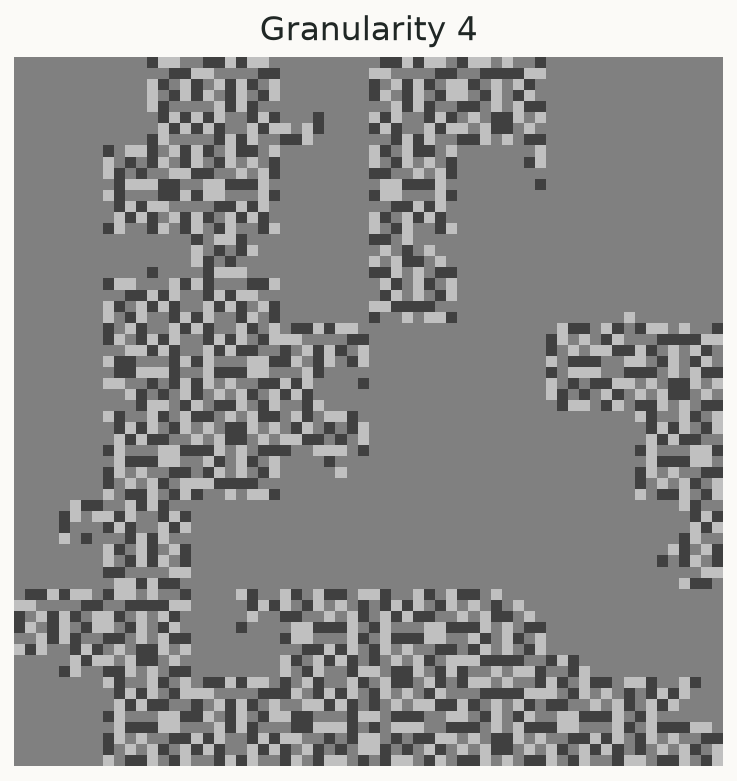
At granularity 4, every aligned period-4 block averages to 1/2 and becomes uniform grey. Period-6 runs produce a repeating sequence of block means 3/4, 1/2, 1/4 and retain variation. The uniform and varying regions separate the two run types. Run lengths are multiples of 12, so boundaries remain aligned with the block grid.
Reproduce the example
import numpy as np
import hilbertplot as hp

def interleaved_periodic(n, seed=3):
    p4, p6 = [1, 0, 0, 1], [1, 1, 0, 1, 0, 0]
    rng = np.random.default_rng(seed)
    seq = []
    while len(seq) < n:
        p = p4 if rng.integers(2) else p6
        length = 12 * int(rng.integers(16, 110))
        seq += (p * (-(-length // len(p))))[:length]
    return np.array(seq[:n], dtype=float)

values = interleaved_periodic(4**7)
fig = hp.plot(values, cmap="gray", vmin=0, vmax=1)
fig = hp.plot(values, granularity=4, cmap="gray", vmin=0, vmax=1)
Both plots use the same color limits. Changing the limits separately would weaken the interpretation of brightness changes.
Block means and the choice of g
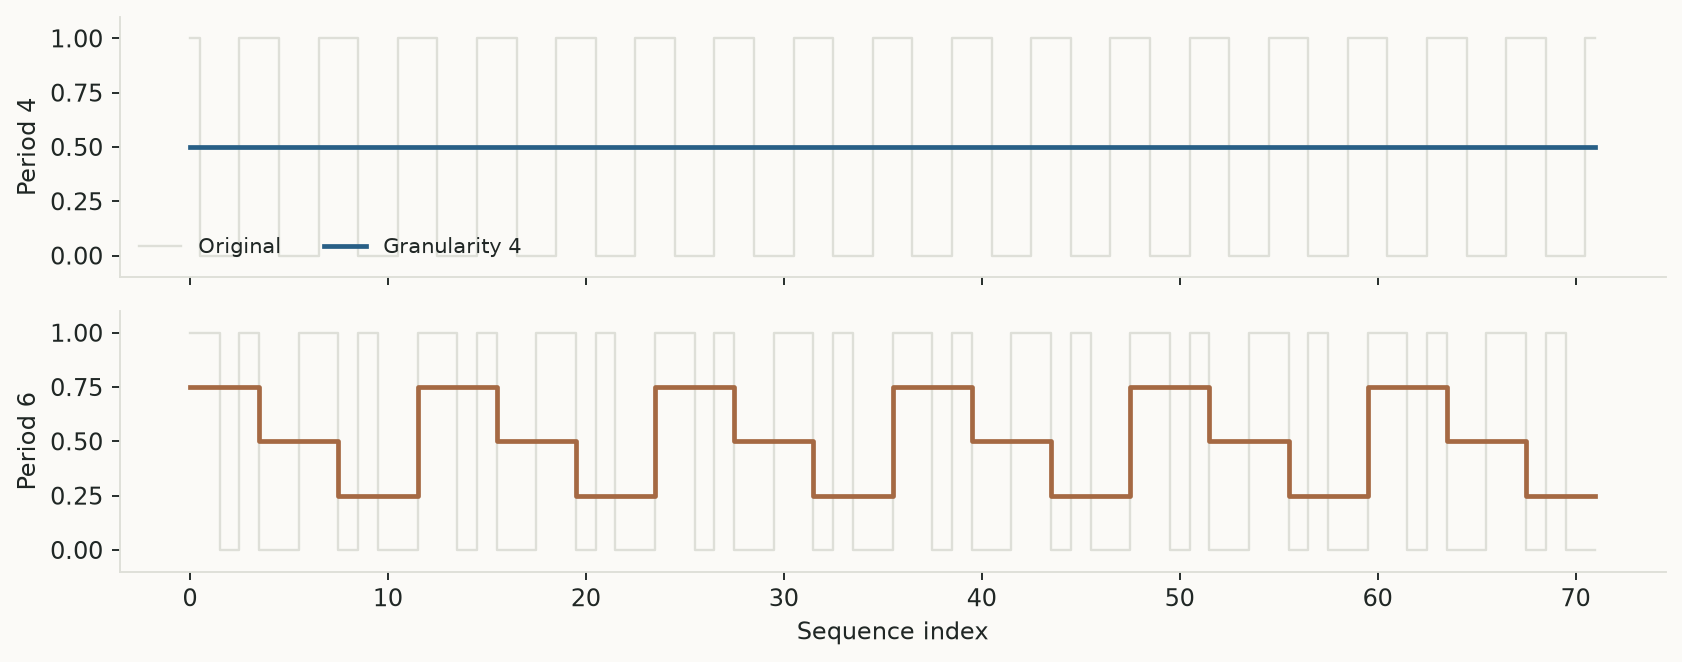
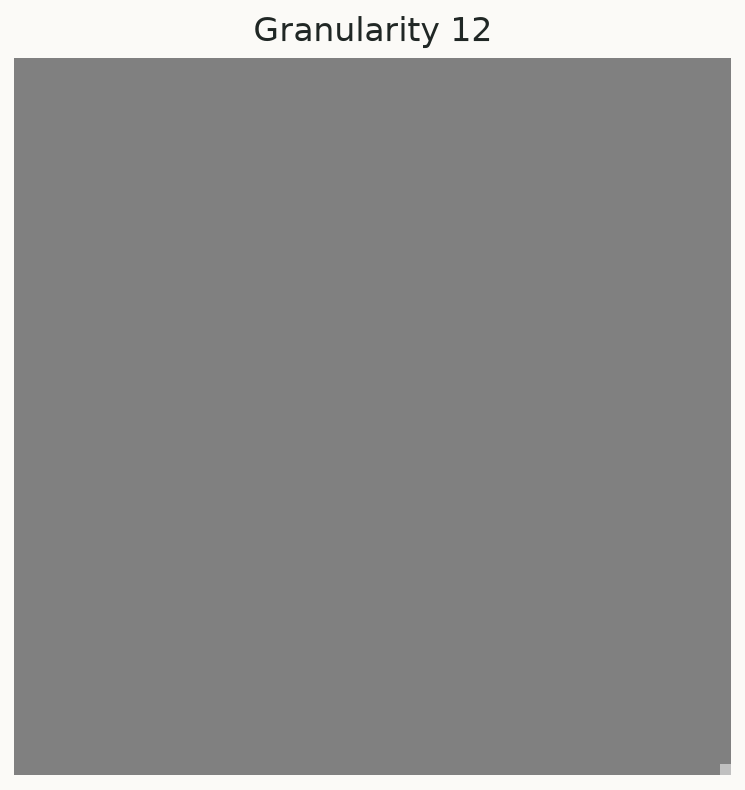
Choosing \(g\) is part of the analysis. A multiple of both periods removes the distinction: at granularity 12, complete blocks of both run types average to 1/2. A final short block, if present, is averaged separately.
Numeric output and missing values
coarse = hp.data.granulate(values, 4)
assert len(coarse) == len(values)
assert hp.data.granulate([0, 2, 10, 14], 2).tolist() == [1, 1, 12, 12]
The standalone helper flattens its input and returns float64. It does not preserve
NumPy masks. In plotting and to_grid(), masked values propagate as missing through
the affected blocks. NaNs propagate through arithmetic means rather than being omitted.
Averaging loses information, so an exact conversion round trip requires granularity 1.