Fit a sequence to a grid
Your sequence length need not be a square or a power of four. fit= decides which grid
to build and whether values may be discarded.
|
Grid selection |
Keeps every value? |
|---|---|---|
|
Smallest enclosing power-of-two square |
Yes |
|
Smallest enclosing arbitrary square |
Yes; supported curves only |
|
Arbitrary square where supported, otherwise power-of-two padding |
Yes |
|
Largest power-of-two square inside the sequence |
No, unless already a matching length |
Concrete example: 900 values
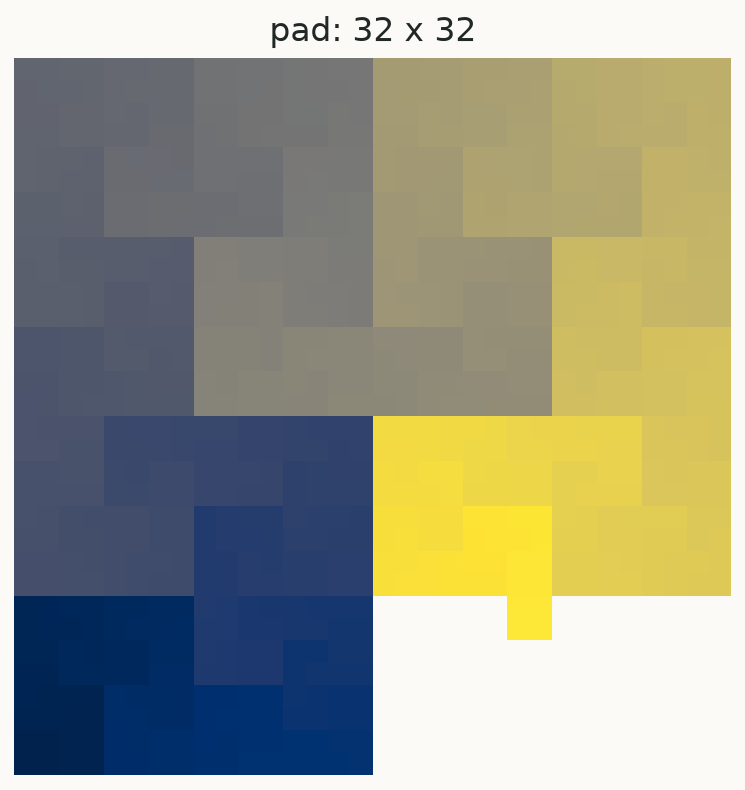
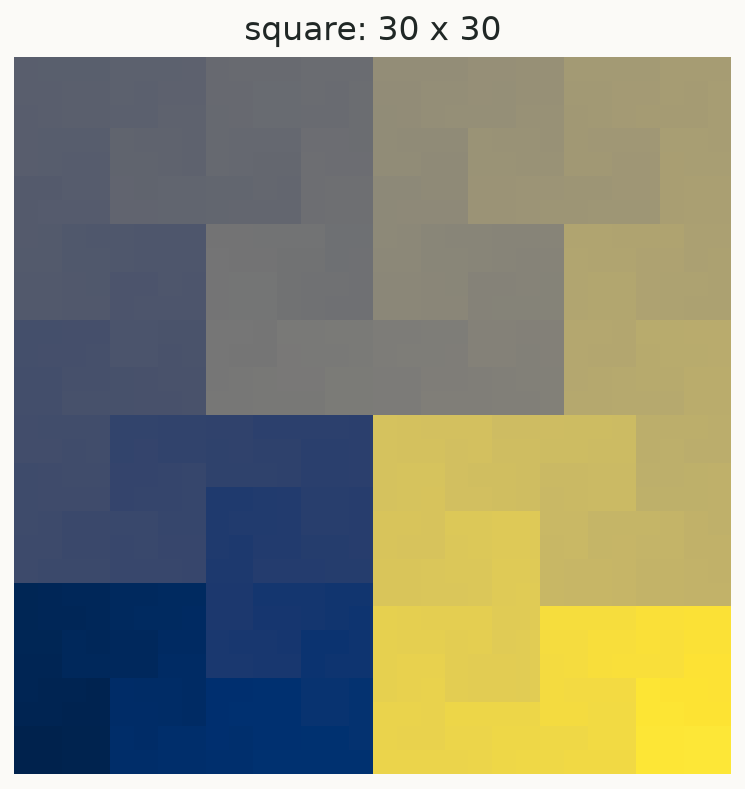
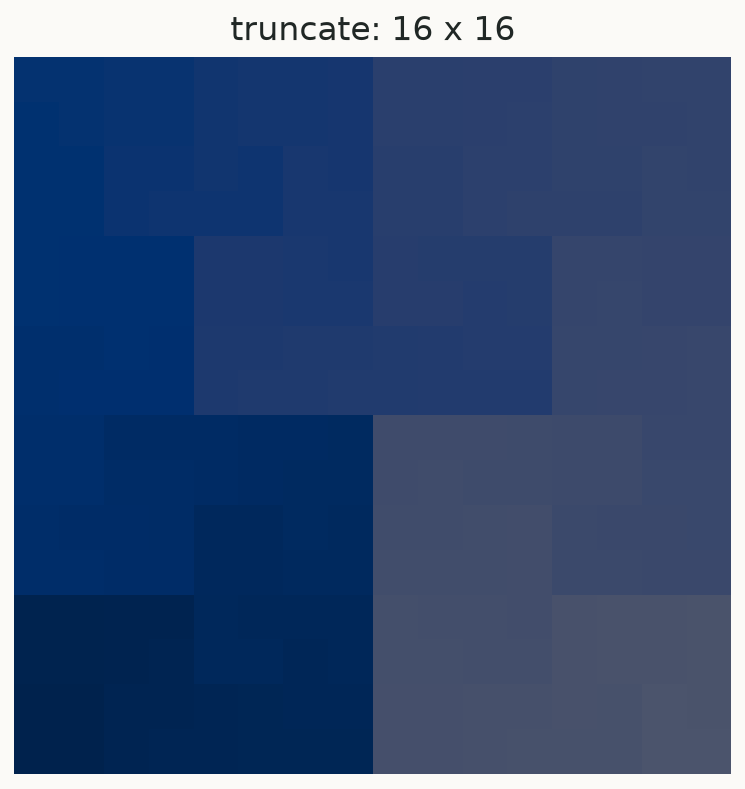
pad: 32×32, with 124 empty cells.square: 30×30, with no empty cells; only the eight generalizing curves support it.truncate: 16×16, retaining the first 256 values and dropping the remaining 644.
truncate chooses among power-of-two side lengths, not all possible square sizes.
import numpy as np
import hilbertplot as hp

values = np.arange(900)

hp.plot(values, fit="pad")
hp.plot(values, curve=0, fit="square")
hp.plot(values, fit="truncate")
Fixed size
order= fixes a power-of-two grid. An order that is too small raises unless truncation is explicit.
hp.plot(values, order=5)                  # 32×32
hp.plot(values, order=4, fit="truncate") # explicitly permit loss
For array reconstruction, hp.data.to_grid(sequence, shape=original.shape) specifies the
original dimensions directly. It uses a supported connected square/quasisquare path.
A shape unsupported by the selected curve raises, even with fit="pad".
Padding and missing values
Plots show NaN padding transparently. Numeric conversion preserves dtypes:
Floating and complex arrays keep their dtype and use NaN padding.
Integer and boolean arrays use NumPy masked padding by default to avoid precision loss.
An explicit representable fill, such as
fill=0, gives ordinary integer padding.
values = np.arange(10, dtype=np.uint64)
grid = hp.data.to_grid(values)
recovered = hp.data.from_grid(grid, length=len(values))
length= keeps the first requested number of returned values. It never guesses which NaNs
or masks are padding; they could be legitimate input data.