Locality and difference maps
Consecutive samples follow adjacent grid cells. Spatial neighbours can nevertheless have widely separated sequence indices. A difference map measures that separation; it is a property of the curve and resolution, independent of measurement amplitudes.
Let \(L[y,x]\) be the visit index of cell \((x,y)\), and let \(\mathcal N(x,y)\) contain its in-bounds horizontal, vertical and diagonal neighbours. The map is
Interior cells have eight neighbours, non-corner edge cells five, and corners three. A single-cell grid returns zero.
Comparing curves
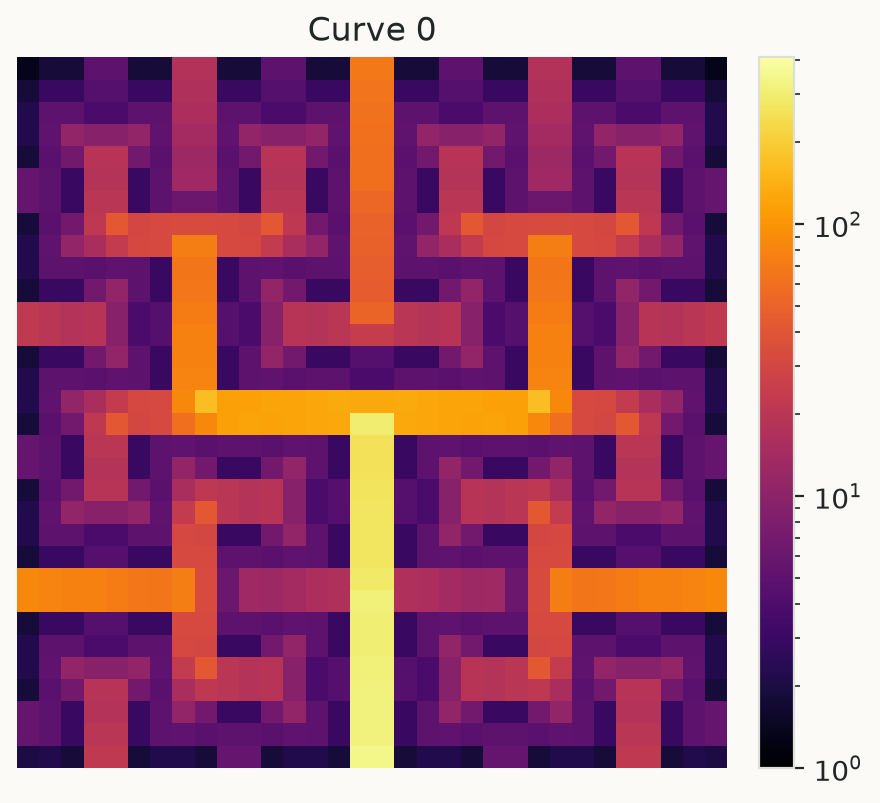
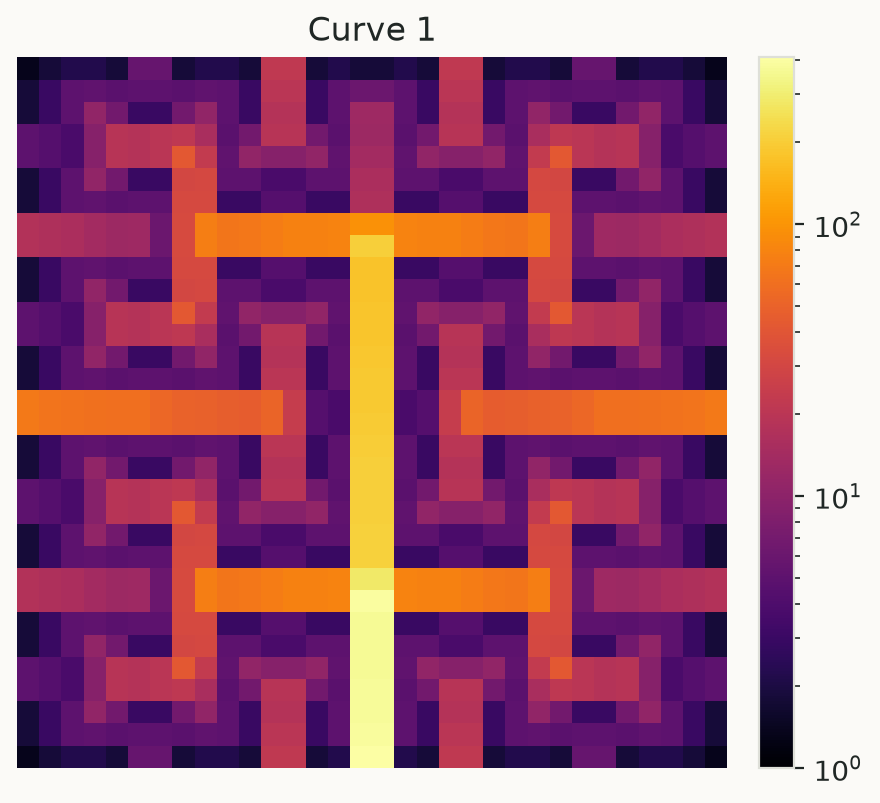
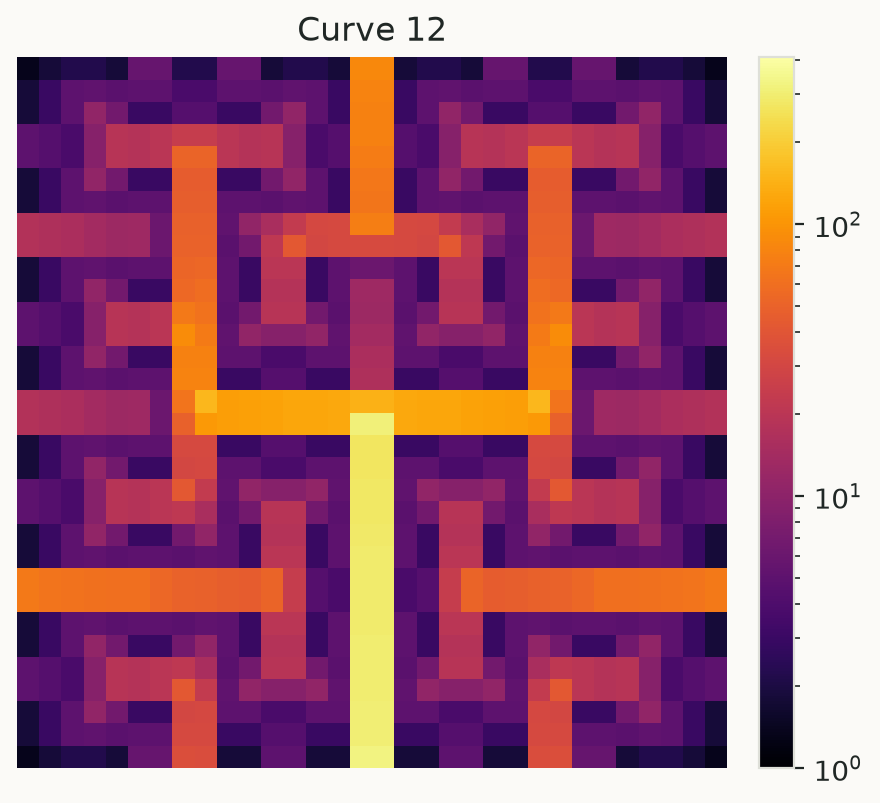
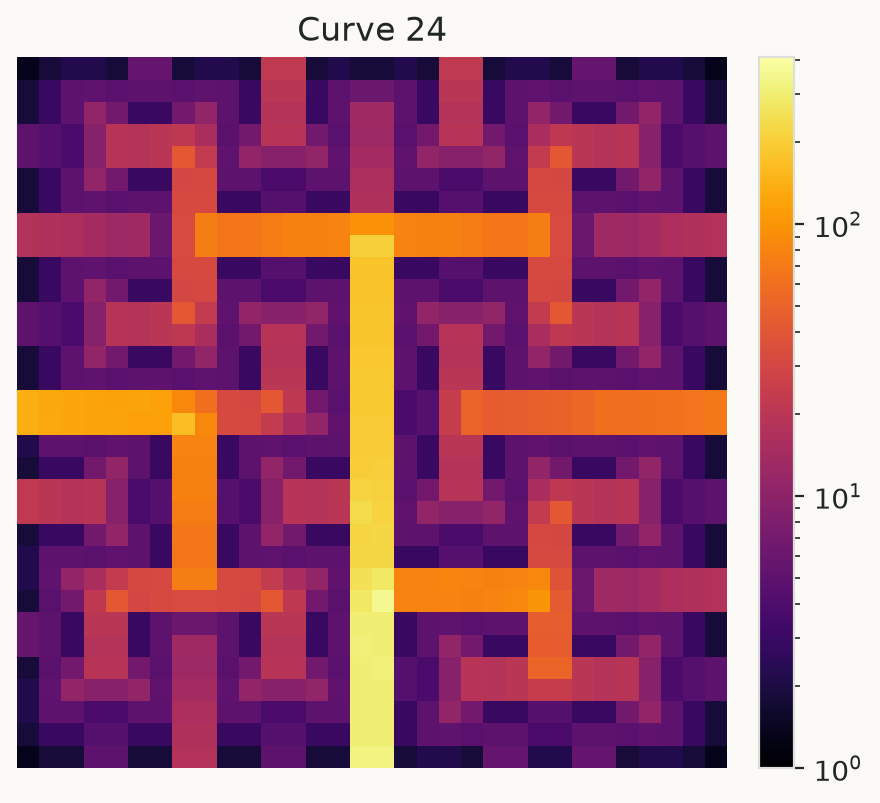
These maps use the same 32-square resolution, inferno colormap and logarithmic
normalization. Low distances remain visible while large jumps at region boundaries
can still be compared. Colorbar values are mean visit-index distances; logarithmic
normalization changes display, not the computed field.
import numpy as np
import hilbertplot as hp
from matplotlib.colors import LogNorm

values = np.arange(4**5)
field = hp.curves.difference_map(0, order=5)
fig = hp.plot(values, curve=0, difference=True, cmap="inferno",
              norm=LogNorm(vmin=1, vmax=field.max()))
A consistent comparison should use a shared vmax, such as the maximum across all
fields being compared. Do not use logarithmic normalization for a one-cell zero field.
Matching a data plot’s grid
values = np.arange(900)
grid = hp.data.to_grid(values, curve=0, fit="square")
field = hp.curves.difference_map(0, side=grid.shape[0])
labels = hp.curves.label_map(0, side=grid.shape[0])
assert field.shape == grid.shape == labels.shape
hp.plot(values, difference=True) uses its fitted grid size; numerical
difference_map() takes a power-of-two order or an explicit square side.
Granularity changes values, not this geometric field. Fourier and difference flags
cannot be enabled together. The difference map fills the complete image.